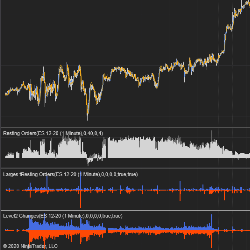
SpeculatorSeth's elite indicators use order flow and level 2 to give day traders and scalpers greater insight into current market conditions and market maker positioning. Includes spread charts to follow the yield curve and a synthetic dollar index.
Use our Auto-Swing Pattern Finder to help find potential market patterns! Swing Pattern Trading is a methodology that utilizes the recognition of specific price patterns and the alignment of exact Fibonacci ratios to determine probable reversal points in the financial markets.
StockAlgo is a cutting-edge trading signal app tailored for NYSE stock traders, delivering accurate signals for NYSE stocks. Benefit from a 3-day free trial to test its reliability. Available on both iOS and Android, StockAlgo equips traders with timely insights to make informed decisions.
This free package includes Symbol Watermark, which shows the name of the symbol and time frame directly on the chart; Trader Limit, which limits trading when the daily loss level is reached; SR Dynamic Lines (dynamic resistance zones); and many other useful tools. These products are free for life.
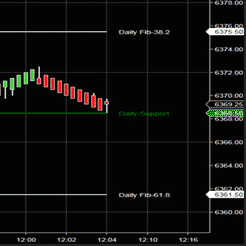
Trading123 Automatic Fibonacci Pivots draws the Fibonacci levels for you. No more second guessing as to where the price action is going. The Fibonacci levels move with the price action from one level to the next. Precise trading using price action for entries and exits at Fibonacci levels.
The SDP History offers multiple ways for the user to visualize the aggressive auction from session to session and monitor for continuation (Leroys) and turning points (Elbows).
Unlock the secrets to market mastery with this 100% free indicator combo. Designed to sharpen your trading and boost your consistency – all with zero cost. Benefit from this comprehensive training and achieve reliable results swiftly. No repaints, just unwavering accuracy!
This model balances four separate risk lenses that seek to generate alpha while moderating standard deviation over multi-year periods. Each risk lens is independently applied based on Alpha Vee's breakthrough fundamental momentum research. Contact Alpha Vee for more information.
Gain a real trading edge. Complete personalized mentorship that teaches you what you need to know to become consistent in the markets. This is designed for struggling traders that actually want to make it. Book a FREE strategy call using the link provided to see if this is right for you.
Simplify your trading with my strategy: trend, price action, support/resistance and momentum. Green/red bars indicate trend, custom ExCon indicator manages setups, pivots show support/resistance and MACD ties it all together. Clear entries, take profits and exits with simple rules for engagement.
December 2, 2024
Mastering Sideways Markets With Auction Bars and Range Projections
November 19, 2024
Enhancing Your Automated Trading System: Key Insights from Best Pro Trade
November 14, 2024
NinjaTrader New Ecosystem Tools: October 2024 Edition
Enter Email for Updates