State-of-the-art NinjaTrader Bot and optimization models for futures retail traders. Designed for retail traders: This program is designed for retail traders seeking consistency on real accounts.
The Tradesight Plus Mentorship is a six-month training program that teaches traders everything they need to know about stocks, futures, options, and Forex. It includes hours of recorded material, plus private mentoring sessions, trade blotter reviews weekly, and access to a live Trading Lab.
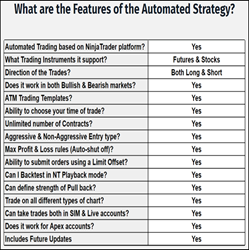
Automated trading tool designed to execute any futures contract based on a combination of predetermined settings and user-defined parameters. It aims to provide high-quality and statistically improved trade entries. One can use these strategies for day trading, and/or scalping intraday price moves.
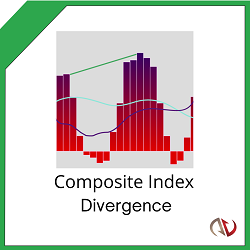
See trend reversals before they happen with intelligent divergence signals! Predict the trend ahead of the crowd with precise entry and exit points. This innovative indicator uses momentum calculations to warn of trend reversals before they happen!
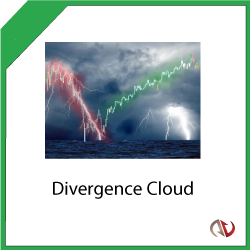
This intelligent indicator will help you predict pullbacks and trend reversals. It uses an innovative form of volatility divergence which helps create consistency. In addition to smart signals and performance statistics, the Divergence Cloud also displays a unique glowing cloud on the chart.
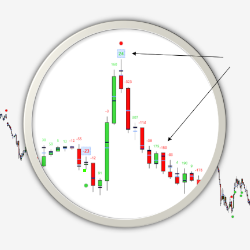
Identify the important buyer and seller zones in each candle by combining the processing of footprint information and a candle chart. Focus on your entries and exits. Get started today with a free 2-week trial!
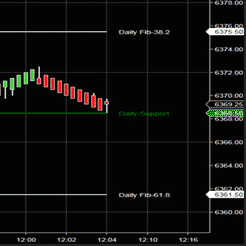
Trading123 Automatic Fibonacci Pivots draws the Fibonacci levels for you. No more second guessing as to where the price action is going. The Fibonacci levels move with the price action from one level to the next. Precise trading using price action for entries and exits at Fibonacci levels.
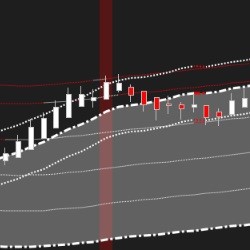
The Linear Regression Trend Lines Indicator dynamically balances the trend on your chart on all time frames. This indicator is built from several linear regression indicators and modified Keltner Channels. Set up to five offset multiplier levels for targets or reversals.
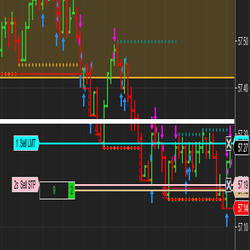
Technical indicator for discretionary trading. It suggests stop-loss and take-profit levels for your entries, considering volatility. It also serves as a trend filter and guide for trailing stop and trailing take-profit. It doesn’t clutter the chart and is adaptable to your strategies and style.
Our intelligent and powerful automated strategies let you rule the markets like a pro. Algos are available for most popular futures markets and are ready to go out of the box. Our strategies are NinjaTrader 7 & NinjaTrader 8 compatible to take your trading to the next level.
December 2, 2024
Mastering Sideways Markets With Auction Bars and Range Projections
November 19, 2024
Enhancing Your Automated Trading System: Key Insights from Best Pro Trade
November 14, 2024
NinjaTrader New Ecosystem Tools: October 2024 Edition
Enter Email for Updates