Q-ProTrader is a fully integrated day trading automated strategy which trades the E-mini futures contract. This package includes both the Q-ProTraderIndicator and Q-ProTraderStrategy.
Channel levels are defined based on high and low prices influenced by candlestick bodies. These points are calculated based on the defined channel levels and look back periods. Delta values are computed to determine the channel's upward or downward slope.
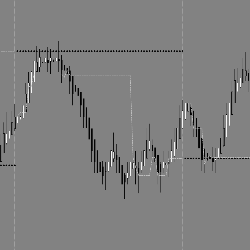
By automatically drawing significant price levels, such as ADR (Average Daily Range) min and max values, yesterday’s OHLC, pivot points (S1, S2, S3 and R1, R2, R3), and weekly OHLC levels, this indicator offers valuable insights to help you make more informed trading decisions.
EPyFVPOC is an indicator which displays in real-time the most traded price of the current day, as well as for any previous days loaded in your chart. It also indicates the Point of Control for the previous session, an important level for intraday traders.
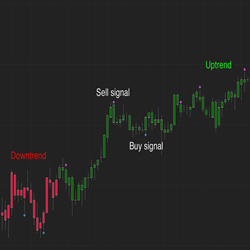
See trend reversals before they happen with intelligent divergence signals! Predict the trend ahead of the crowd with precise entry and exit points. This innovative indicator uses momentum calculations to warn of trend reversals before they happen!
The PTG Trader Tool Box v1.0 Software Suite includes the full package of ALL 27 Polaris Trading Group Indicators. Discover a wide variety of ways to look at the markets to accommodate and enhance your trading plan.
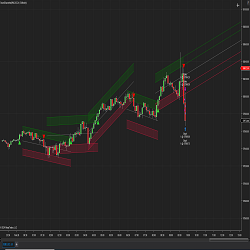
Side-Bias Indicators include intelligent moving averages and a trailing stop indicator for NinjaTrader. Included are 3 proprietary calculations that track price very accurately yet smoothly, offering stunning support and resistance levels. They pick a side to stick to price while avoiding whipsaws.
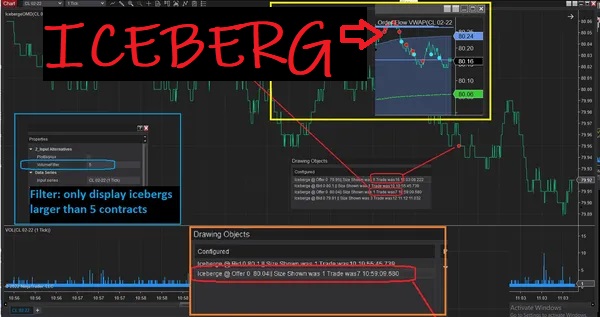
Detect sophisticated large traders, attempting to obfuscate their trading by only posting or displaying a portion of their order size. Indicator will highlight prices on a chart where iceberg was used and for how many contracts.
The Zero To Hero Trade Course aims to teach aspiring traders how to be consistent in their trading results. Students will learn about different approaches to trading, different styles, tricks and techniques used by the pros, as well as the psychological side of trading.
Download this free indicator that allows you to trade directly on your chart. You no longer need to use buttons to enter the market. With this indicator, you can select your entry point directly on the chart. Quickly place limit orders with a single click of the mouse (no need to right-click).
December 2, 2024
Mastering Sideways Markets With Auction Bars and Range Projections
November 19, 2024
Enhancing Your Automated Trading System: Key Insights from Best Pro Trade
November 14, 2024
NinjaTrader New Ecosystem Tools: October 2024 Edition
Enter Email for Updates