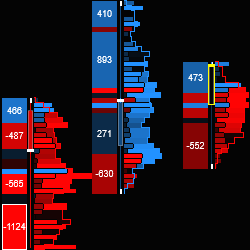
Delta Visualization System. Next-generation aggregate-able tick view of underlying order flow. Adaptive learning system highlights important price action. Bar and zone volume profile and Delta. Anchored VWAP and key Fibs. View Mini and Micro contracts on one chart. The edge you've been missing!
VWAP shows S/R levels, which the majority of institutional algorithms use. It works with all trading instruments (Forex, Futures, Indexes, Commodities, Stocks) and time frames (day trading, swing trading, position trading). It includes VWAP Training Video Course and VWAP trading setups.
Automated Trading Strategy for trading MNQ.
Our Compass is a complete trading model with an Automatic ATM Entry Assistant. Dimension Trader Compass has a consistent track record and provides Daily Power Fibs for many markets and pre-designed workspaces. It is easy to use and understand!
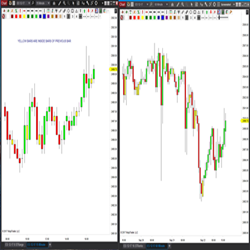
Highly customizable indicator allowing traders to track volatility without spending time staring at a screen. Candlesticks are represented by different custom colors depending on the direction of price movement & its amplitude. Notifications are also sent via email, text or by your favorite sound.
With no coding required, StratGen allows the everyday trader to generate strategies. In a couple of clicks, traders can generate strategies with over +1,000 signals at their fingertips. Generate strategies using indicators, price action, time of day, alternate exits and much more.
The VTP was created to provide Veterans with an introduction to financial markets. The Stage 5 Online Course educates traders on how to approach their funding challenges within the Prop Firm space. It aims to helping support traders to succeed, and build a sustainable trading business.
The ST Inside Bars visually displays when a time-based bar forms inside a previous bar, also known as a Mother Bar. Learn more about ST Inside Bars today!
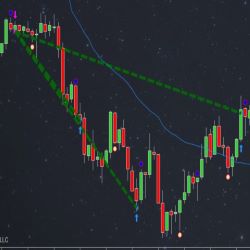
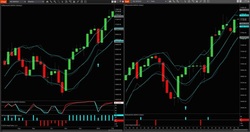
IATrend gives a clear indication of the trend of any financial instrument and does so on all different time frames.
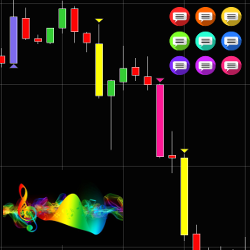
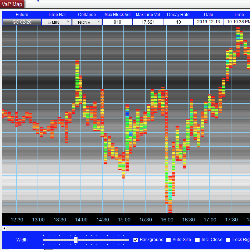
Visualize the market like never before. The VAPMap (Volume At Price Map) displays the total volume traded at each price and time, using a color spectrum from red (lowest) to blue (highest). The background lines show the total historical traded volume for every price level. Click for a free trial.
December 2, 2024
Mastering Sideways Markets With Auction Bars and Range Projections
November 19, 2024
Enhancing Your Automated Trading System: Key Insights from Best Pro Trade
November 14, 2024
NinjaTrader New Ecosystem Tools: October 2024 Edition
Enter Email for Updates