The TSR Indicator Pack is designed to help you focus on price action. Find price action patterns like Pin Bar, Inside Day, and Hikkake with ease. With it, you can also paint your chart background according to the slope of any indicator. Never lose track of price action again. Pay what you want!
The Helix strategy is the combination of our Entry Zone indicator and the Trade Management strategy, hence the name Helix (or double Helix). Helix allows you to create your Entry Zones based on your setup rules. Then, after trade execution, Helix will manage the trade based on your rules.
Ultimate Support and Resistance Suite provides precise support and resistance lines and zones to trade any market on any time-frame. This tool enables you to accurately determine which supply and demand price levels require your attention. Use it as a standalone indicator or enhance any system.
The Tradesight Plus Subscription includes access to their live Trading Lab, a suite of ten NinjaTrader add-on tools, plus all their stocks, futures, Forex, and options calls throughout the day. The subscription also includes the Tradesight Forex and Futures Levels.
Don't miss any more targets by a few ticks with Target Zone!
Larry Cheung’s investment community provides investment research regarding U.S and Chinese macroeconomics and company-specific fundamental analysis. He also uses technical analysis and order flow to best understand risk/reward for entries and exits across different timeframes.
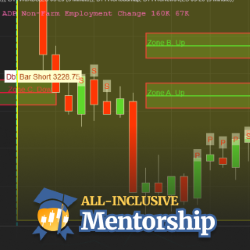
Become a pro trader via an eight-week trading school. All courses & software are included. Receive live training from a coach who teaches you over 10 price action methods & how they work together to form a complete plan for daily trading. Learn the exclusive Roadmap & Blueprint techniques.
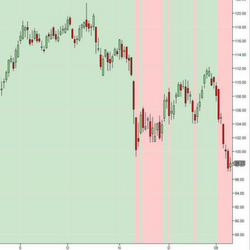
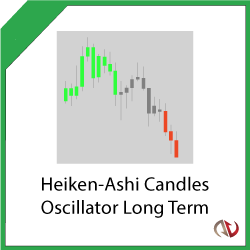
Eliminate noise with this indicator and identify long lasting and actionable trends with zero lag! It accurately visualizes trends and works on any chart type, detecting Bullish, Bearish and Neutral markets.
Daily Levels plots important levels such as prior days open/high/low/mid/close, overnight high/low/mid, IB high/low and more! It also displays historical probabilities of price touching each level in regular and overnight sessions for the most popular futures products.
Deer Creek Enterprises takes your ideas and makes them real for your trading style and needs. We have years of programming service with fast turnaround and support to our customers as well as a vast knowledge of NinjaTrader. Contact us for a free quote and get your ideas coded for trading!
December 2, 2024
Mastering Sideways Markets With Auction Bars and Range Projections
November 19, 2024
Enhancing Your Automated Trading System: Key Insights from Best Pro Trade
November 14, 2024
NinjaTrader New Ecosystem Tools: October 2024 Edition
Enter Email for Updates