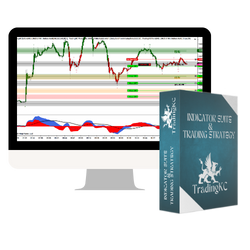
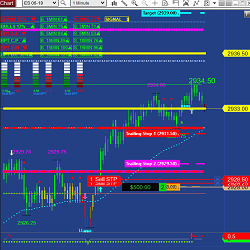
Simplify your trading with my strategy: trend, price action, support/resistance and momentum. Green/red bars indicate trend, custom ExCon indicator manages setups, pivots show support/resistance and MACD ties it all together. Clear entries, take profits and exits with simple rules for engagement.
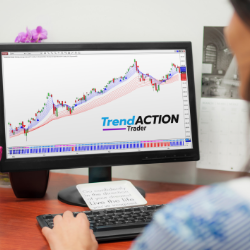
Trend Action Trader keeps you on the right side of the market with clear high probability signals for all markets and timeframes. Its price patterns and momentum algorithm are ideal whether you trade short or long term. Improve your trading consistency - try risk-free for 30-days!
Take emotion out of trading with auto/semi-automated trading. Use your own or recommended bars. Built in filters. Tradable on any futures market. Semi-automation for best consistency. Customizable ATM strategies, daily profit and loss targets. Great value for both beginners and experts.
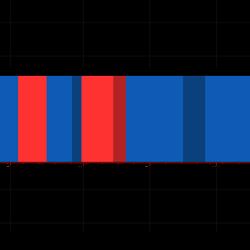
Stay in your trades for longer using our HeatMap indicator. One of the toughest problems can be getting into a trend or staying in a trend until the end. HeatMap looks at 4 factors which determine a trend and displays the results in an easy-to-read heatmap right on your charts.
TradingCoders offers custom indicator and automated trading strategy programming services. TradingCoders possesses intimate knowledge of trading and NinjaTrader, and builds projects ranging from simple alerts and visuals, to sophisticated multi-timeframe techniques of price and cycle analysis.
12tradepro.com provides advanced, highly predictive, and reasonably priced software for trading global financial instruments in multiple time frames. Our technologies incorporate rule-based discretionary, semi-automated and fully automated approaches.
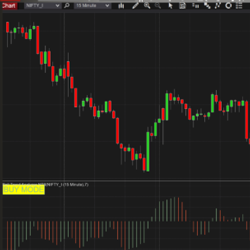
The Bell Trend Analyzer provides directional bias for a trader and helps identify early trend formation. Bars are colored for quick trend identification with proper text annotations.
To receive their free Weekly Market Movers trading schedule, just enter your email in the "" Get Free Training Video "" box. See how they schedule their trades each week as they will email you their free weekly trading schedule.
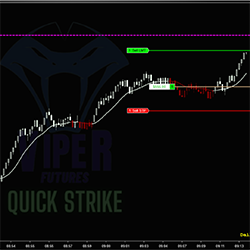
If you seek a trend-following system capable of minimizing failed entry signals in choppy markets, your search ends with RK-System Platinum v4. This system provides up to 4 signal types, with the price action signal type proving to be particularly reliable and productive in our backtesting.
Innovative Trading Solutions has been building indicators, fully-automated or ATM Strategies, chart types, and chart styles to client specifications for over 8 years. They also offer NinjaTrader 7 to NinjaTrader 8 conversion services. Get a free quote for your project today!
December 2, 2024
Mastering Sideways Markets With Auction Bars and Range Projections
November 19, 2024
Enhancing Your Automated Trading System: Key Insights from Best Pro Trade
November 14, 2024
NinjaTrader New Ecosystem Tools: October 2024 Edition
Enter Email for Updates