Do you spend hours reviewing charts and performing repetitive analysis and/or trade management? Why not define your trade setups and let me code them so that you get an alert each time a setup presents itself? Even have them built into an automated strategy.
Daily Levels plots important levels such as prior days open/high/low/mid/close, overnight high/low/mid, IB high/low and more! It also displays historical probabilities of price touching each level in regular and overnight sessions for the most popular futures products.
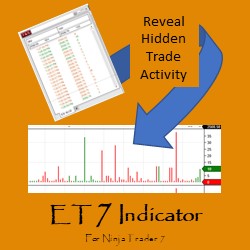
Elephant Tracks Software’s ET 7 allows traders to select just the trade sizes they want to see, revealing hidden patterns. This advanced Time & Sales information can be highly beneficial for individual traders to understand institutional trading behavior. Get started with a 2-week free trial!
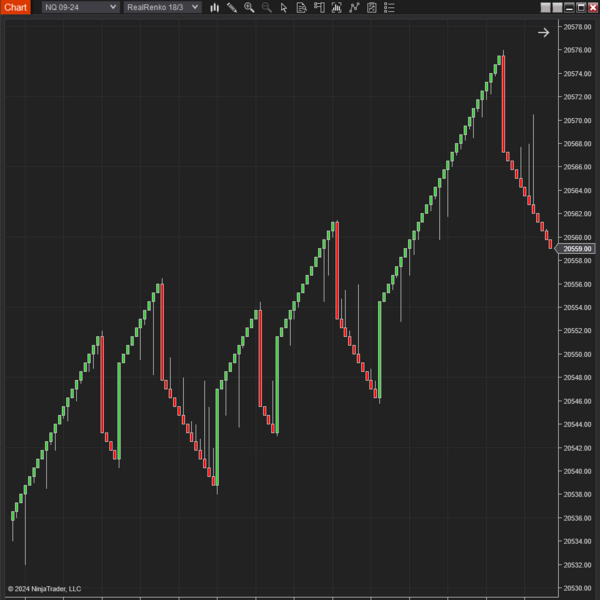
Enhance your trading strategy with RealRenko Bars! Designed for precision and flexibility, these bars allow you to set a custom brick size and trend threshold, providing a clearer picture of market movements.
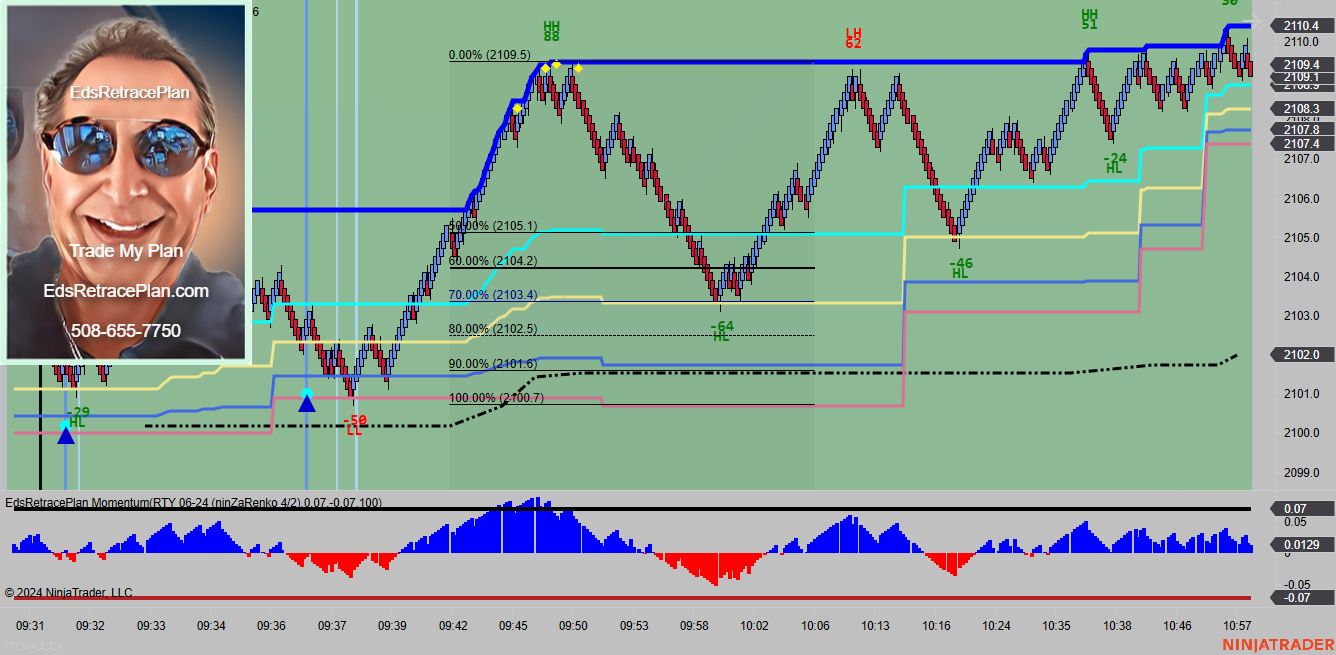
EdsRetracePlan Momentum Reversal Indicator is for day trading ES, YM, RTY, NQ, CL and GC. The indicator identifies reversal trades by finding and marking tops and bottoms. These trades signal the end of a move and opportunities to get short at the highs and long at the lows.
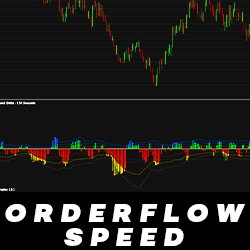
Deceptively simple, Orderflow Speed allows you to monitor market speed and enables you to view trading activity directly from your chart. It supports the Tick Replay feature so that you can visualize historical trading activity.
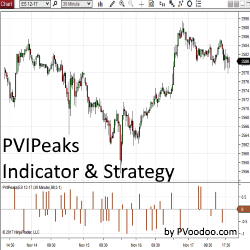
PVIPeaks Indicator and Strategy pinpoints peaks from any standard NinjaTrader indicator and allows traders to use them to generate a signal for an automated strategy. This tool is available exclusively for NinjaTrader 8. Get your free trial today!
Trail a stop automatically behind a wide range of indicators: Price Action, ATR, Bollinger Band, Swing, Parabolic SAR, Donchian Channel, or 9 different Moving Averages. Trailing Stop Expert works on Futures, Forex or Stocks. Grab a 7-day free trial now!
This ES S&P Day trading course uses Fibonacci technical analysis to identify entry and exit strategies. Rose has backtested for many years to determine the optimal Fibonacci Retracement and Extension levels for a consistent system. Get started with a free consultation with Rose!
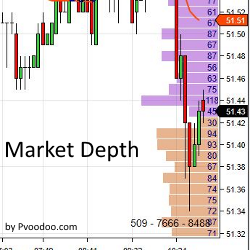
The addition of Market Depth indicators allow traders to see the bid/ask data based on price in real time. Similar to the Level II data featured in the NinjaTrader SuperDOM, the Market Depth Indicator plots bid/ask data directly on a chart. Learn more!
December 2, 2024
Mastering Sideways Markets With Auction Bars and Range Projections
November 19, 2024
Enhancing Your Automated Trading System: Key Insights from Best Pro Trade
November 14, 2024
NinjaTrader New Ecosystem Tools: October 2024 Edition
Enter Email for Updates