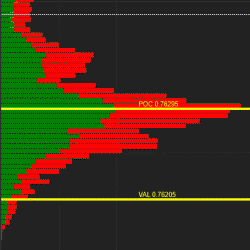
itcMarketProfile is a highly customizable indicator for monthly, weekly and daily market profile. It draws the profile and important levels like POC, VAH and VAL. The value area volume percentage is adjustable, and the indicator can display historical values of POC, VAH, VAL as an option.
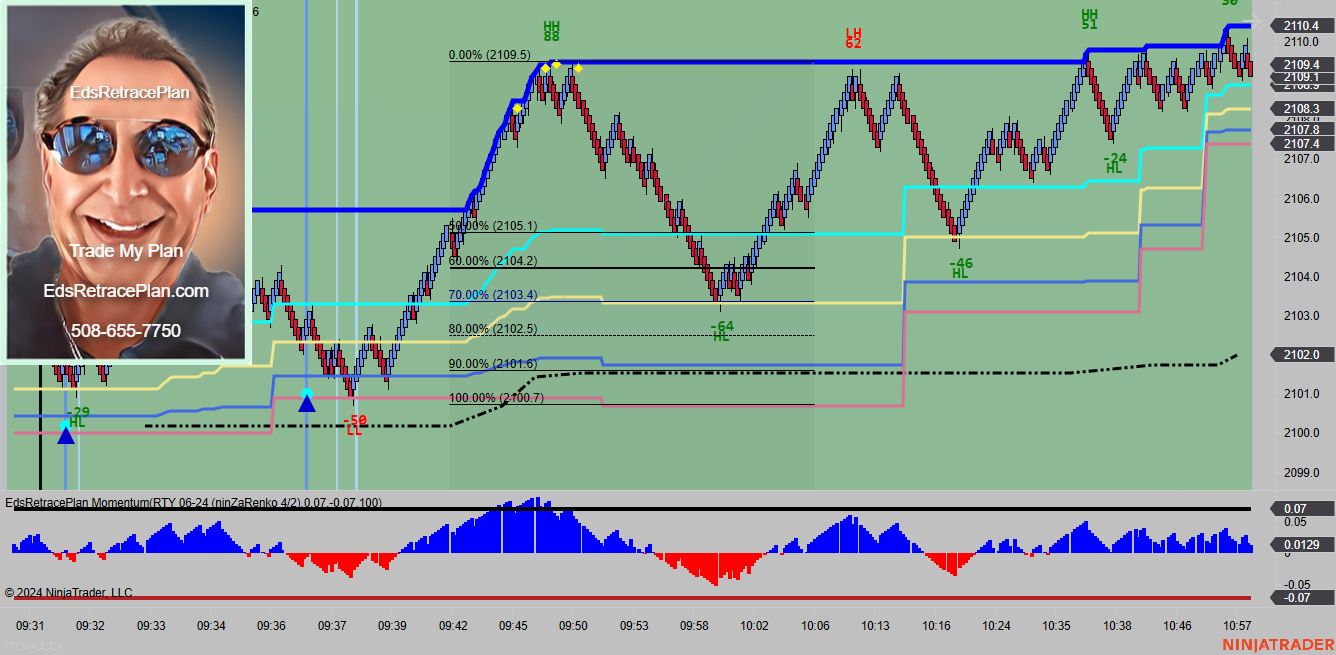
EdsRetracePlan Momentum Reversal Indicator is for day trading ES, YM, RTY, NQ, CL and GC. The indicator identifies reversal trades by finding and marking tops and bottoms. These trades signal the end of a move and opportunities to get short at the highs and long at the lows.
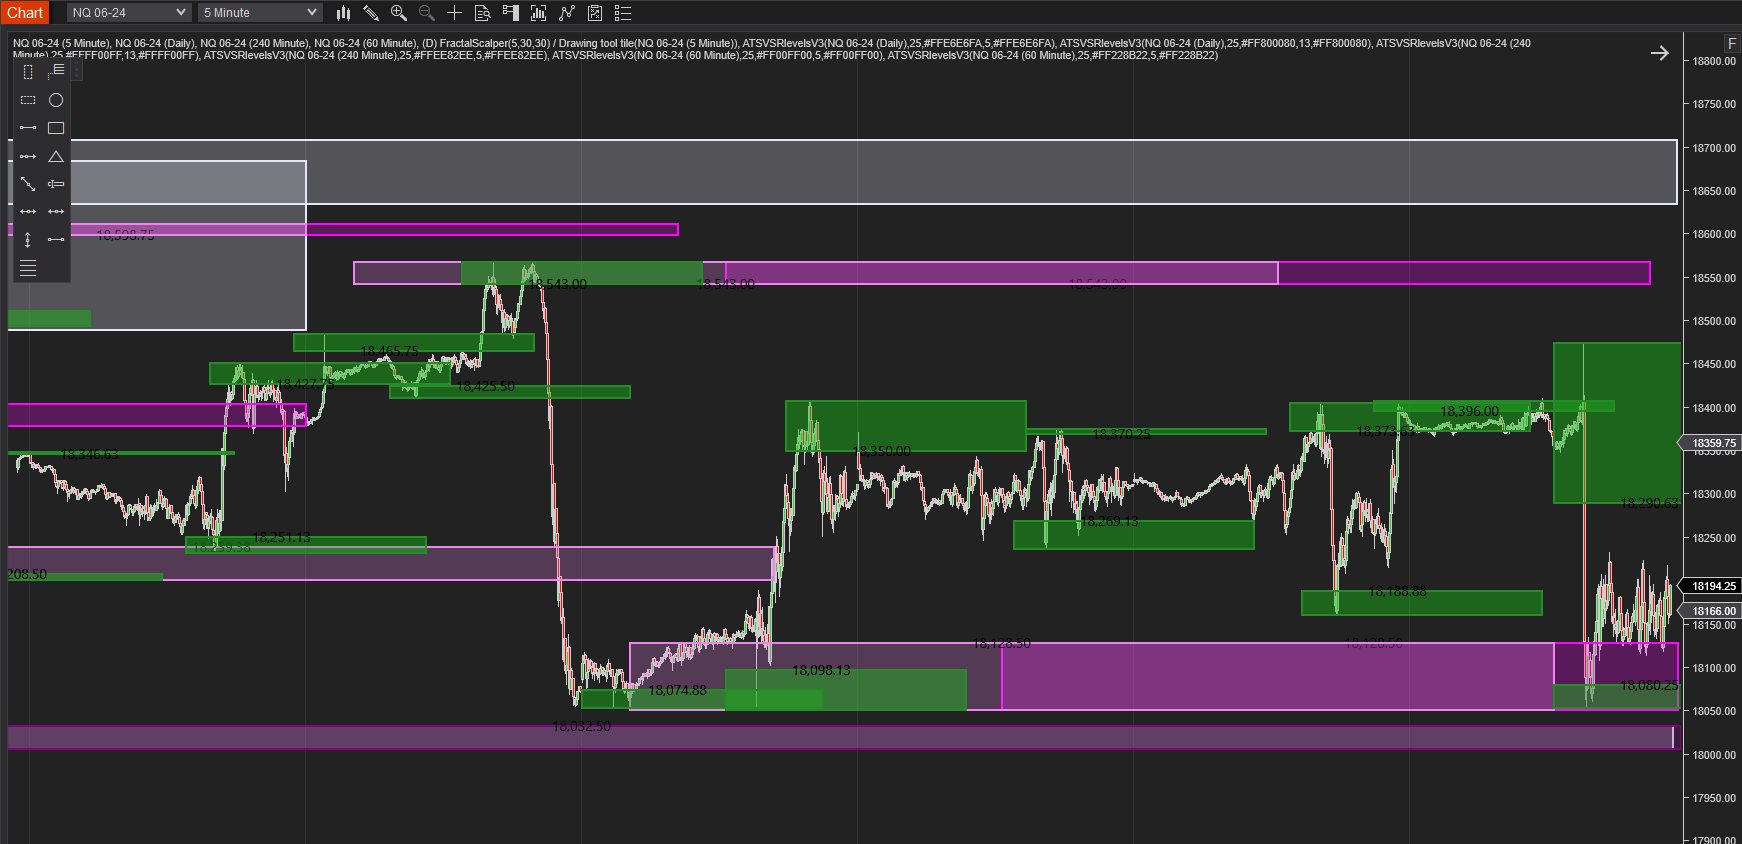
This indicator is designed to provide the trader with better trade locations by plotting visual support and resistance levels at swing points in the market. When multiple data series are used, the ATS VSR Levels can be plotted using the higher timeframe.
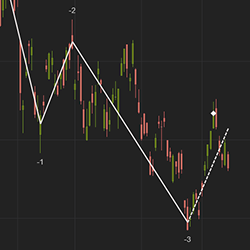
The Wave indicator is similar to an Elliot Wave with an added capability to forecast a possible market reversal. It has convenient features including the ability to number waves to help identify trend direction.
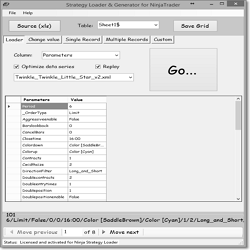
The Ninja Strategy Generator allows traders to make changes to the Parameters record that exports from NinjaTrader to create new strategies with slight variations of the strategy you wish to optimize.
Securely access NinjaTrader desktop from any device, any location. Host your NinjaTrader desktop application on a VPS to improve the application’s accessibility, security and flexibility. Please mention NinjaTrader in your registration (problem) for advanced support.
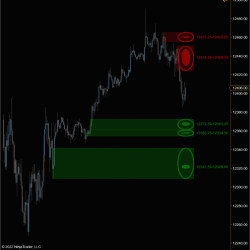
Patented! 'UFOs' stands for UnFilled Orders. Intelligent technology saves time and adds precision when planning entries and exits. Identify buy and sell UnFilled Orders in all markets and timeframes. Answers the question, “What is potentially an intelligent buying price or selling price?”
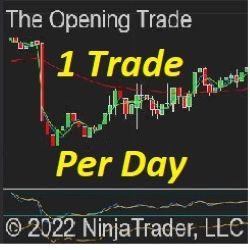
Signals are produced by an imbalance of prices between sessions, a principle of markets based in physics. You have the potential of 1 trade per day, automated from start to finish and designed to be monitored in some capacity. Users have full control of strategy parameters.
Enhance your trading strategy by visually delineating the Asia and London trading sessions on your charts. This powerful tool highlights the start and end times of these sessions, marks the high and low points, and extends these levels until the end of the New York regular trading session.
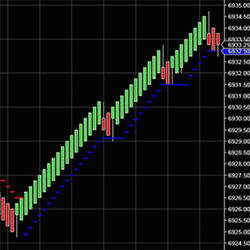
Trailing Stops move with the price action, not a lagging indicator. The indicator was designed for traders to use and to have no hassles of calculating your stop losses. The software does it automatically; never second guess the trend again. Can be used to lock in and protect your profits.
December 2, 2024
Mastering Sideways Markets With Auction Bars and Range Projections
November 19, 2024
Enhancing Your Automated Trading System: Key Insights from Best Pro Trade
November 14, 2024
NinjaTrader New Ecosystem Tools: October 2024 Edition
Enter Email for Updates