FREE indicators and workspaces to follow along with Horst's YouTube tutorials and videos. Check out live daily YouTube trades on the website & discover the ability to see upcoming moves clearly & logically before they happen. Download the free workspaces & indicators today!
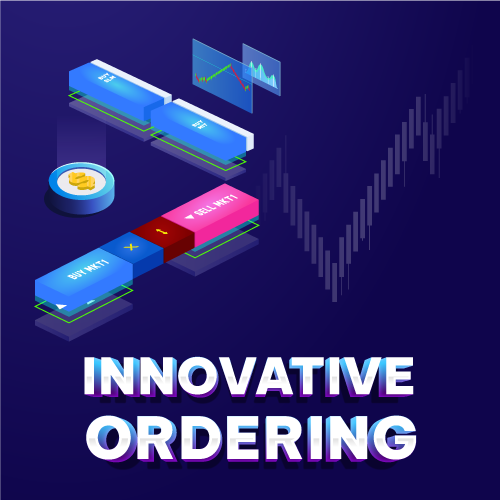
Ideal for those wanting to place pending orders with a single click, execute lightning-fast market orders, or simplify trading for users with slower computers or impaired eyesight. Key features include support for various order types, quantity presets, ATM selector, and real-time status display.
Download this free indicator that allows you to trade directly on your chart. You no longer need to use buttons to enter the market. With this indicator, you can select your entry point directly on the chart. Quickly place limit orders with a single click of the mouse (no need to right-click).
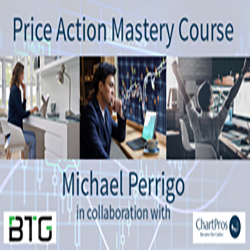
Learn everything you need to know about charts and technical analysis to become consistent in the markets. This course includes basic structure, support/resistance, trend, supply/demand, Fibonacci, change control zones, divergence, trading psychology, and putting it all together.
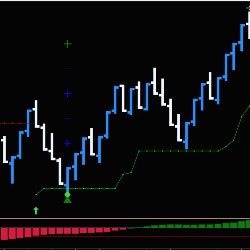
The ATS_TrendRider indicator toolset plots trend reversals and trend extensions. Fully customizable for your trading preference, each identified trade plots the entry, stop loss, and profit targets based upon current ATR.
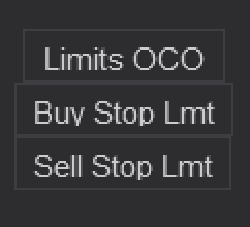
Bars Edge Trader Button and OCO Timer pack for NinjaTrader 8. An easy fast solution to apply Limit Orders to your Chart Trader. Included are three timers for adding OCO Limits entries throughout the day to catch a news cycles semi-automatically.
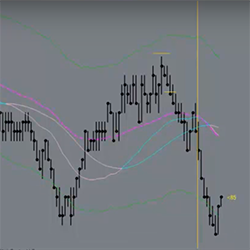
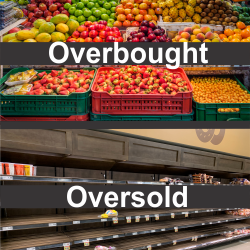
No subchart indicators or additional time frame charts are required to see when price becomes overbought or oversold. This helps the trader identify weakness in an uptrend or strength in a downtrend to anticipate a potential change in price direction. An award winning "heads-up display" indicator!
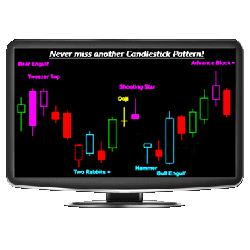
Want to scan for any candlestick pattern, on any timeframe, across any list of symbols? Whether you're interested in the most common or advanced patterns, the Candlestick X-Ray™ detects over 90 unique candlestick patterns, making it a highly flexible and powerful candlestick pattern tool.
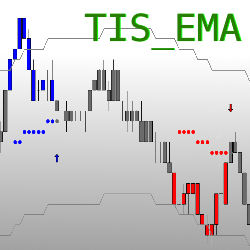
The TIS_EMA_Trader Setup trades bounces over a user defined Exponential Moving Average, making it ideal for low volatility trending markets. The logic of this system can also be inverted for a unique trade setup.
DTB Ultimate Bands is a next-generation of price envelopes that does all the heavy-lifting for traders. Once applied on a price chart, it pinpoints Overbought and Oversold areas with unmatched accuracy. Get a free trial!
December 2, 2024
Mastering Sideways Markets With Auction Bars and Range Projections
November 19, 2024
Enhancing Your Automated Trading System: Key Insights from Best Pro Trade
November 14, 2024
NinjaTrader New Ecosystem Tools: October 2024 Edition
Enter Email for Updates