Several studies have found a connection between full and new moons and stock market performance. Knowing how and when to time the cycles in trend shifts is centuries old, but new to most traders.
Delta Volume Supply and Demand Indicator that comes with a Semi Auto Chart Trader. Prop firm compliant for evaluations and live accounts. Reads what is happening right now in the market with no lag. Templates, workspaces and manual included. Works in all markets. Free 7-day Trial.
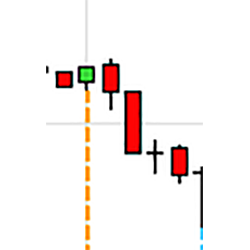
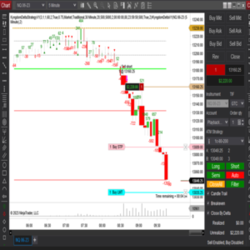
Semi-auto trading tool used to help enter and manage trades when using Renko style charts. Customize entry condition, stops, targets, breakeven and trail.
ChartVPS provides high-end virtual private servers (VPS) to traders, enabling them to automate strategies & securely trade from any device, anywhere 24/7. Our servers & network are built specifically for trading & NT platform, ensuring compatibility, ultra-low latency & smooth operation.
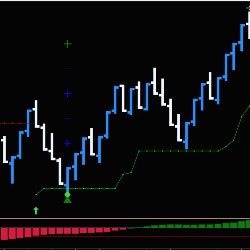
The ATS_TrendRider indicator toolset plots trend reversals and trend extensions. Fully customizable for your trading preference, each identified trade plots the entry, stop loss, and profit targets based upon current ATR.
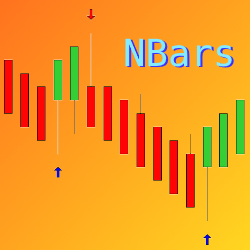
The TIS_NBars_UpDown indicator paints signals of the "OpenClose Setup" on the chart. It detects bar color changes and includes multiple filters for fine-tuning. See a video demonstration of the Nbars indicator in action.
Innovative Trading Solutions has been building indicators, fully-automated or ATM Strategies, chart types, and chart styles to client specifications for over 8 years. They also offer NinjaTrader 7 to NinjaTrader 8 conversion services. Get a free quote for your project today!
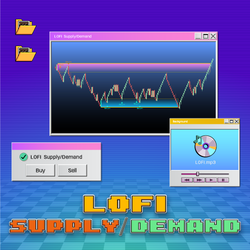
LOFI Supply/Demand goes beyond zone identification, delivering trading signals. It offers three distinctive signals within each zone: Pullback, Return, and Break signals. The indicator's well-defined rules ensure only the highest-opportunity signals are revealed, maintaining a clear chart.
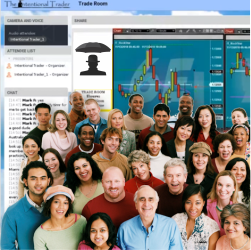
Day trading six futures instruments every day from 9am until 12pm Eastern time. Watch the Intentional Trader system in action in real time. Listen to a trade room moderator call out trades before entering them. They have been trading the same system and indicators since 2009!
The Tradesight Plus Subscription includes access to their live Trading Lab, a suite of ten NinjaTrader add-on tools, plus all their stocks, futures, Forex, and options calls throughout the day. The subscription also includes the Tradesight Forex and Futures Levels.
December 2, 2024
Mastering Sideways Markets With Auction Bars and Range Projections
November 19, 2024
Enhancing Your Automated Trading System: Key Insights from Best Pro Trade
November 14, 2024
NinjaTrader New Ecosystem Tools: October 2024 Edition
Enter Email for Updates