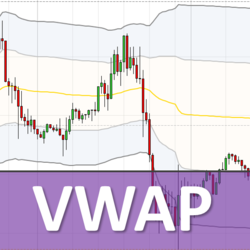
VWAP shows S/R levels, which the majority of institutional algorithms use. It works with all trading instruments (Forex, Futures, Indexes, Commodities, Stocks) and time frames (day trading, swing trading, position trading). It includes VWAP Training Video Course and VWAP trading setups.
This workshop will help you decide if trading could be for you. It demonstrates all aspects of trading - managing risk, trading techniques, technical analysis, trading psychology, creating a trading plan and what to include. Join in with your laptop or computer.
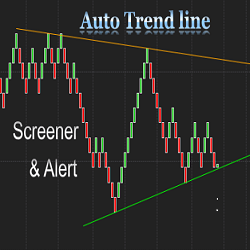
The Auto Trend Line Alert indicator will automatically plot the upper and lower trend lines based on the most recent swing points. It works on all timeframes. The NinjaTrader Market Analyzer makes it possible to track price action related to trend lines in any timeframe.
Channel VA MNTrader is a fully automated trading system. Trading is based on Renko strategy using a Keltner Channels indicator. The filtration system is based on the ADXVMA & the MACD indicator. It has an improved position support system with flexible settings that will improve trading consistency.
OTS Trading Strategies - Drawing from over 30 years of trading experience, OTS is delighted to offer exclusive insights into proprietary trading strategies.
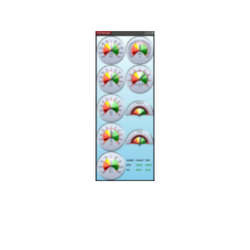
The CB Internals Panel shows you the breadth of the market long and short term. Combined with custom audio alert, it lets you know when the market is moving. It has been in development since 2016, and the current version stands alone.
HelloWin Backtest is a revolutionary trading analysis tool offering an intuitive PnL graph for real-time system evaluation. Supporting various bar types, slippage adjustments, and a unique two-round logic for defining entries, it mirrors the strategic approach of professional traders.
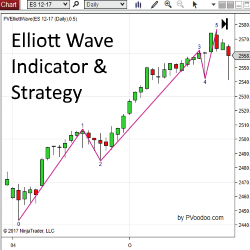
PVElliottWave Indicator is an Elliott Wave indicator designed for the NinjaTrader platform. Get started with a free trial of this indicator now!
Highly sought after day trading strategy and methods course. Featuring the successful "Ultimate 25Bar, Ultimate Backdoor, and Ultimate Slingshot" systems. Complete with over 65 videos and more. Over 13 years strong. Includes access to our Ultimate Scalper group chat and text support.
The Roller Coaster is a Stochastic/MACD cross indicator with special EMA Points of Control for both long and short trades. Our algorithm works everything out behind the scenes, keeping your chart clean.
December 2, 2024
Mastering Sideways Markets With Auction Bars and Range Projections
November 19, 2024
Enhancing Your Automated Trading System: Key Insights from Best Pro Trade
November 14, 2024
NinjaTrader New Ecosystem Tools: October 2024 Edition
Enter Email for Updates