The Lighthouse Trading strategy works fully automatically in the futures market. Besides trading in different markets simultaneously, you can configure it in distinct ways in each one of them. The algorithm analyses time and sales, volume, rhythm and acceleration in real time.
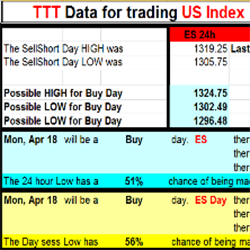
Based on the trading techniques of George Taylor, the TTT E-Book provides the necessary data to trade using the Taylor Trading Technique. After the market close receive 24 hour and daily data to plan your trades for the next trading session. Free 1-week trial available!
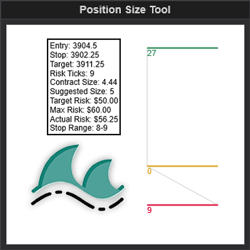
This indicator allows the user to get the position size based on the stop size of the Risk Reward tool. This increases application functionality and user charting efficiency.
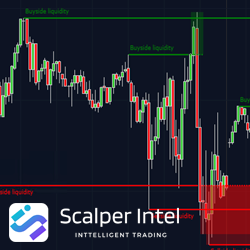
Unlock your trading strategy's potential with the Buyside & Sellside Liquidity Indicator. Gain deep insights into liquidity dynamics in ICT Trading methodology. Key features include Buyside and Sellside liquidity levels, revealing support and resistance zones, and Liquidity Voids.
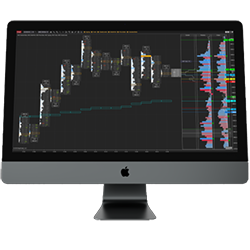
A comprehensive indicator suite for order flow and volume analysis. MarketProfile charts show the bigger picture, BookFlow visually displays the real time and historical order book and Footprint charts reveal the aggressive side of the market. Trade room access and a 14-day free trial are included.
edgeful breaks down market data into easy to read reports that instantly show you how any asset behaves, down to a specific weekday. They have all the breakdowns to tell traders when to size into a trade, when to size down, and even where to set your profit targets, based on the data, not opinions."
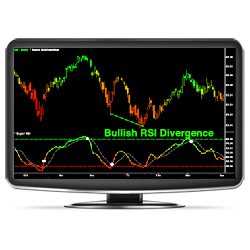
The Super RSI™ Indicator Package overcomes the limitations of the tradational RSI & offers several powerful new features making it more effective than ever before! Upgrade to a smoother RSI that utilizes the state-of-the-art "Divergence Engine" and Dynamic Overbought/Oversold Levels!
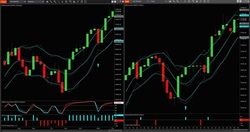
IAStealth signals the entry when the shorter time frame momentum has reversed back in the direction of the trend. More important is to know when the longer time frame momentum is showing signs of reversing. IAStealth alerts the shorter time frame after IAMomentum/IATrend alert the longer time frame.
State-of-the-art NinjaTrader Bot and optimization models for futures retail traders. Designed for retail traders: This program is designed for retail traders seeking consistency on real accounts.
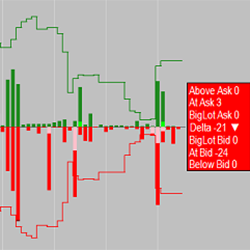
Use the Tape? Time & Sales can be hard to follow; however, this indicator boils it down to an easy to read histogram. Easily see the bid & ask trades, above ask & below bid trades, BigLot trades, the delta bid/ask ratio and much more. Learn more about the BigLotHistogram indicator now!
December 2, 2024
Mastering Sideways Markets With Auction Bars and Range Projections
November 19, 2024
Enhancing Your Automated Trading System: Key Insights from Best Pro Trade
November 14, 2024
NinjaTrader New Ecosystem Tools: October 2024 Edition
Enter Email for Updates