Chompsky Bands: Single and second entry reversal signals and momentum signals, including MACD V5 signals. Includes min/max Bars Per Minute (BPM) filter, Trend Resilience, EMA Tick Separation Filter, Wave Counter. Signal outputs and customizable tags.
QuantCycles harnesses artificial intelligence (AI) and machine learning (ML) for superior predictability, stability and chart analysis. With refined algorithms using advanced Fourier cycle analysis, Hurst cycles and W.D. Gann theories, this latest version delivers exceptionally accurate forecasting.
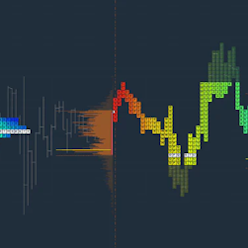
This Order Flow indicator package takes the information overload out of interpreting complex footprint charts and volume data by doing the calculations internally, and then plotting easy to read objects on the chart. Your membership includes the software, one month trade room access and mentorship.
Futures Analytica's PolarityATI leverages market microstructure and order flow imbalances for automated trading. It features a dynamic machine learning module, offering traders a sophisticated and adaptable tool for market engagement, while eliminating any subjectivity in setup and configuration.
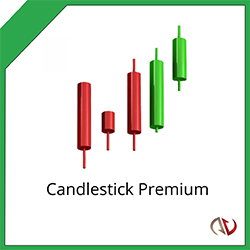
Trade smarter with multiple candlestick patterns. This indicator uses pattern recognition to scan for 16 different candlestick patterns. It detects bullish, bearish and gap patterns. It can be used with Bloodhound and NinjaTrader's Market Analyzer.
This course is designed to get you up and running with strategy design and coding for NinjaTrader 8. It provides the most efficient framework that you can adapt for the architecture of most systems and demonstrates various ways to enter and exit the market using the most standard techniques.
Every download will receive a 14-day Free Trial of the app on either Android or Iphone. You will be able to test the technology, analysis, trading signals and everything else at no cost. See how Forex Trading Unlocked can enhance your forex and futures trading. Gain trading consistency!
Track the open and close sessions of up to four different market times on your chart. A marker plots offset above and below the bar that corresponds to your time setting, which are all parameters that the user custom configures in the indicator properties window.
Highly customizable indicator allowing traders to track volatility without spending time staring at a screen. Candlesticks are represented by different custom colors depending on the direction of price movement & its amplitude. Notifications are also sent via email, text or by your favorite sound.
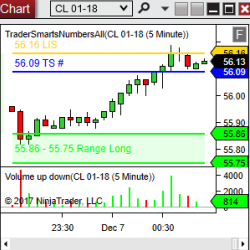
TS Trades is live market commentary, focused on identifying trade setups that are forming in real-time based on input from TS TradePlan. Get started with a 2-week trial for your favorite markets.
December 2, 2024
Mastering Sideways Markets With Auction Bars and Range Projections
November 19, 2024
Enhancing Your Automated Trading System: Key Insights from Best Pro Trade
November 14, 2024
NinjaTrader New Ecosystem Tools: October 2024 Edition
Enter Email for Updates