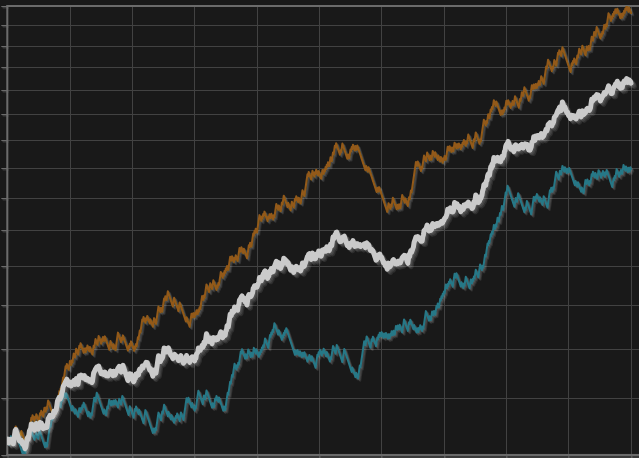
This is a trend following trading system trading simultaneously on three configurable and back testable time frames. It is aimed to be used as a CTA, trend following, multi assets trading system where the tradable assets universe is composed by futures on indices, commodities and foreign exchanges.
This platform offers a comprehensive library of trading indicators, tailored specifically for the web version of NinjaTrader and Tradovate. It’s a simple subscription service, giving you the freedom to fine-tune your strategies without the burden of buying multiple tools.
The Line Break Bar is one of the most effective ways to reduce chart noise. It provides accurate back-testing results by showing the correct open prices and restoring the wicks. Easily recognize divergence & price action patterns & eliminate noise from traditional minute charts. Get started today!
The Volatility Index (VIX) is a real-time market index that represents the market's expectation of 30-day forward-looking volatility. The VIX moves inversely to the indices and is often used as an indicator of upcoming market moves to time precise entries and exits. AKA Fear Gauge or Fear Index
A catalog of tools for traders available through subscription plans, offering a comprehensive set of features for enhanced trading. Access strategies, indicators, and other solutions designed to help you trade more effectively in the market.
This trading indicator is the ultimate “go/no-go gauge” for any trading strategy. A sub-chart that looks up six timeframes and gives real-time BIAS. Bullish, neutral or bearish on each level. Making decisions and acting on trading signals made easier!
Join the PFA Community and get the Supply Demand Trading Course, Software licenses, forum access, live training room and more! Monthly, yearly & lifetime license packages available!
The LogikTickX utilizes signal processing and price reconstruction techniques to cut through the noise, reconstructing the true transaction, minimizing the hiding of large orders. This allows traders to identify and react to the market sentiment, and correlation between price and volume development.
High performance, fully-automated night and day trading for NQ and MNQ. The VX9 wakes up before sunrise and finds the best trading opportunities in the morning twilight. Built from scratch to be a true day trading system, the VX9 offers simplicity and performance.
Would you like to learn how to code your own strategies, indicators, bar types, optimization algorithms and amazing .NET extensions? This course, taught by Yuri Zolotarev, contains over 60 lectures and more than 5 hours of content. In addition, we are always updating this program with new material.
December 2, 2024
Mastering Sideways Markets With Auction Bars and Range Projections
November 19, 2024
Enhancing Your Automated Trading System: Key Insights from Best Pro Trade
November 14, 2024
NinjaTrader New Ecosystem Tools: October 2024 Edition
Enter Email for Updates