Improve Your Trade is a fully-automated trading journal which records and tracks every trade you make automatically. It even adds screenshots of your trades, allowing you to focus on the important things like analyzing your trading performance!
Our Stock Trading Package includes pre-built workspaces, chart templates and Market Analyzers with scanners and alerts. Use ATS Chart Trader for trade management, ATS Inflection Point indicator for daily inflection points and use DTS Ichimoku Cloud Pattern for trade setups. Education is included!
Denotes fitness functions in the NinjaTrader 8 platform, evaluating trading strategies' performance. By leveraging specific parameters, they assist traders in analyzing, comparing and selecting the most effective trading methodologies.
Experience a revolutionary approach to charts, utilizing moving averages for open, high, low and last prices. Explore diverse chart types, including minute, tick and volume charts. Uncover trends and reversal patterns.
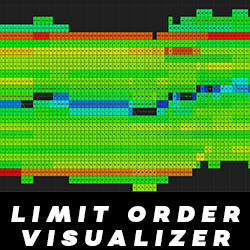
View in real time the Orderbook, executed trades, limit orders, and the bid / ask spread. Change settings without refreshing your chart. Add your favorite indicators to the chart. Limit Order Visualizer is compatible with Market Replay; thus you can review Orderbook action on your charts!
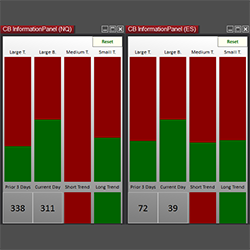
CB Information Panel gives you a snapshot of the buyers and sellers. Keep track of the prior day’s ranges and trend movement.
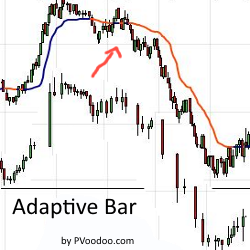
The AdaptiveBar is a revolutionary bar type that incorporates volume, time and range. Available exclusively for NinjaTrader 8 this bar dynamically captures volume and range data based on a user defined time frame to add clarity to market behavior. Learn more!
Maximize trading with Modena Wick Trader, offering total control, dynamic market adaptation and custom settings for optimal efficiency. Automation to the next level!
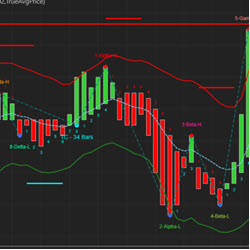
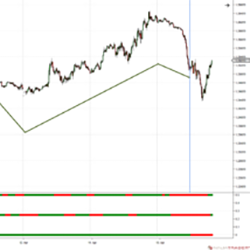
The EnlightCoders HeadScalper gives you market direction with a traffic light plot – red or green. SAT (Scalp Auto Trend) is a versatile and self-adapting tool to identify what is happening in the big picture. It reduces noise with smart filters and shows just one thing: the trend in red or green.
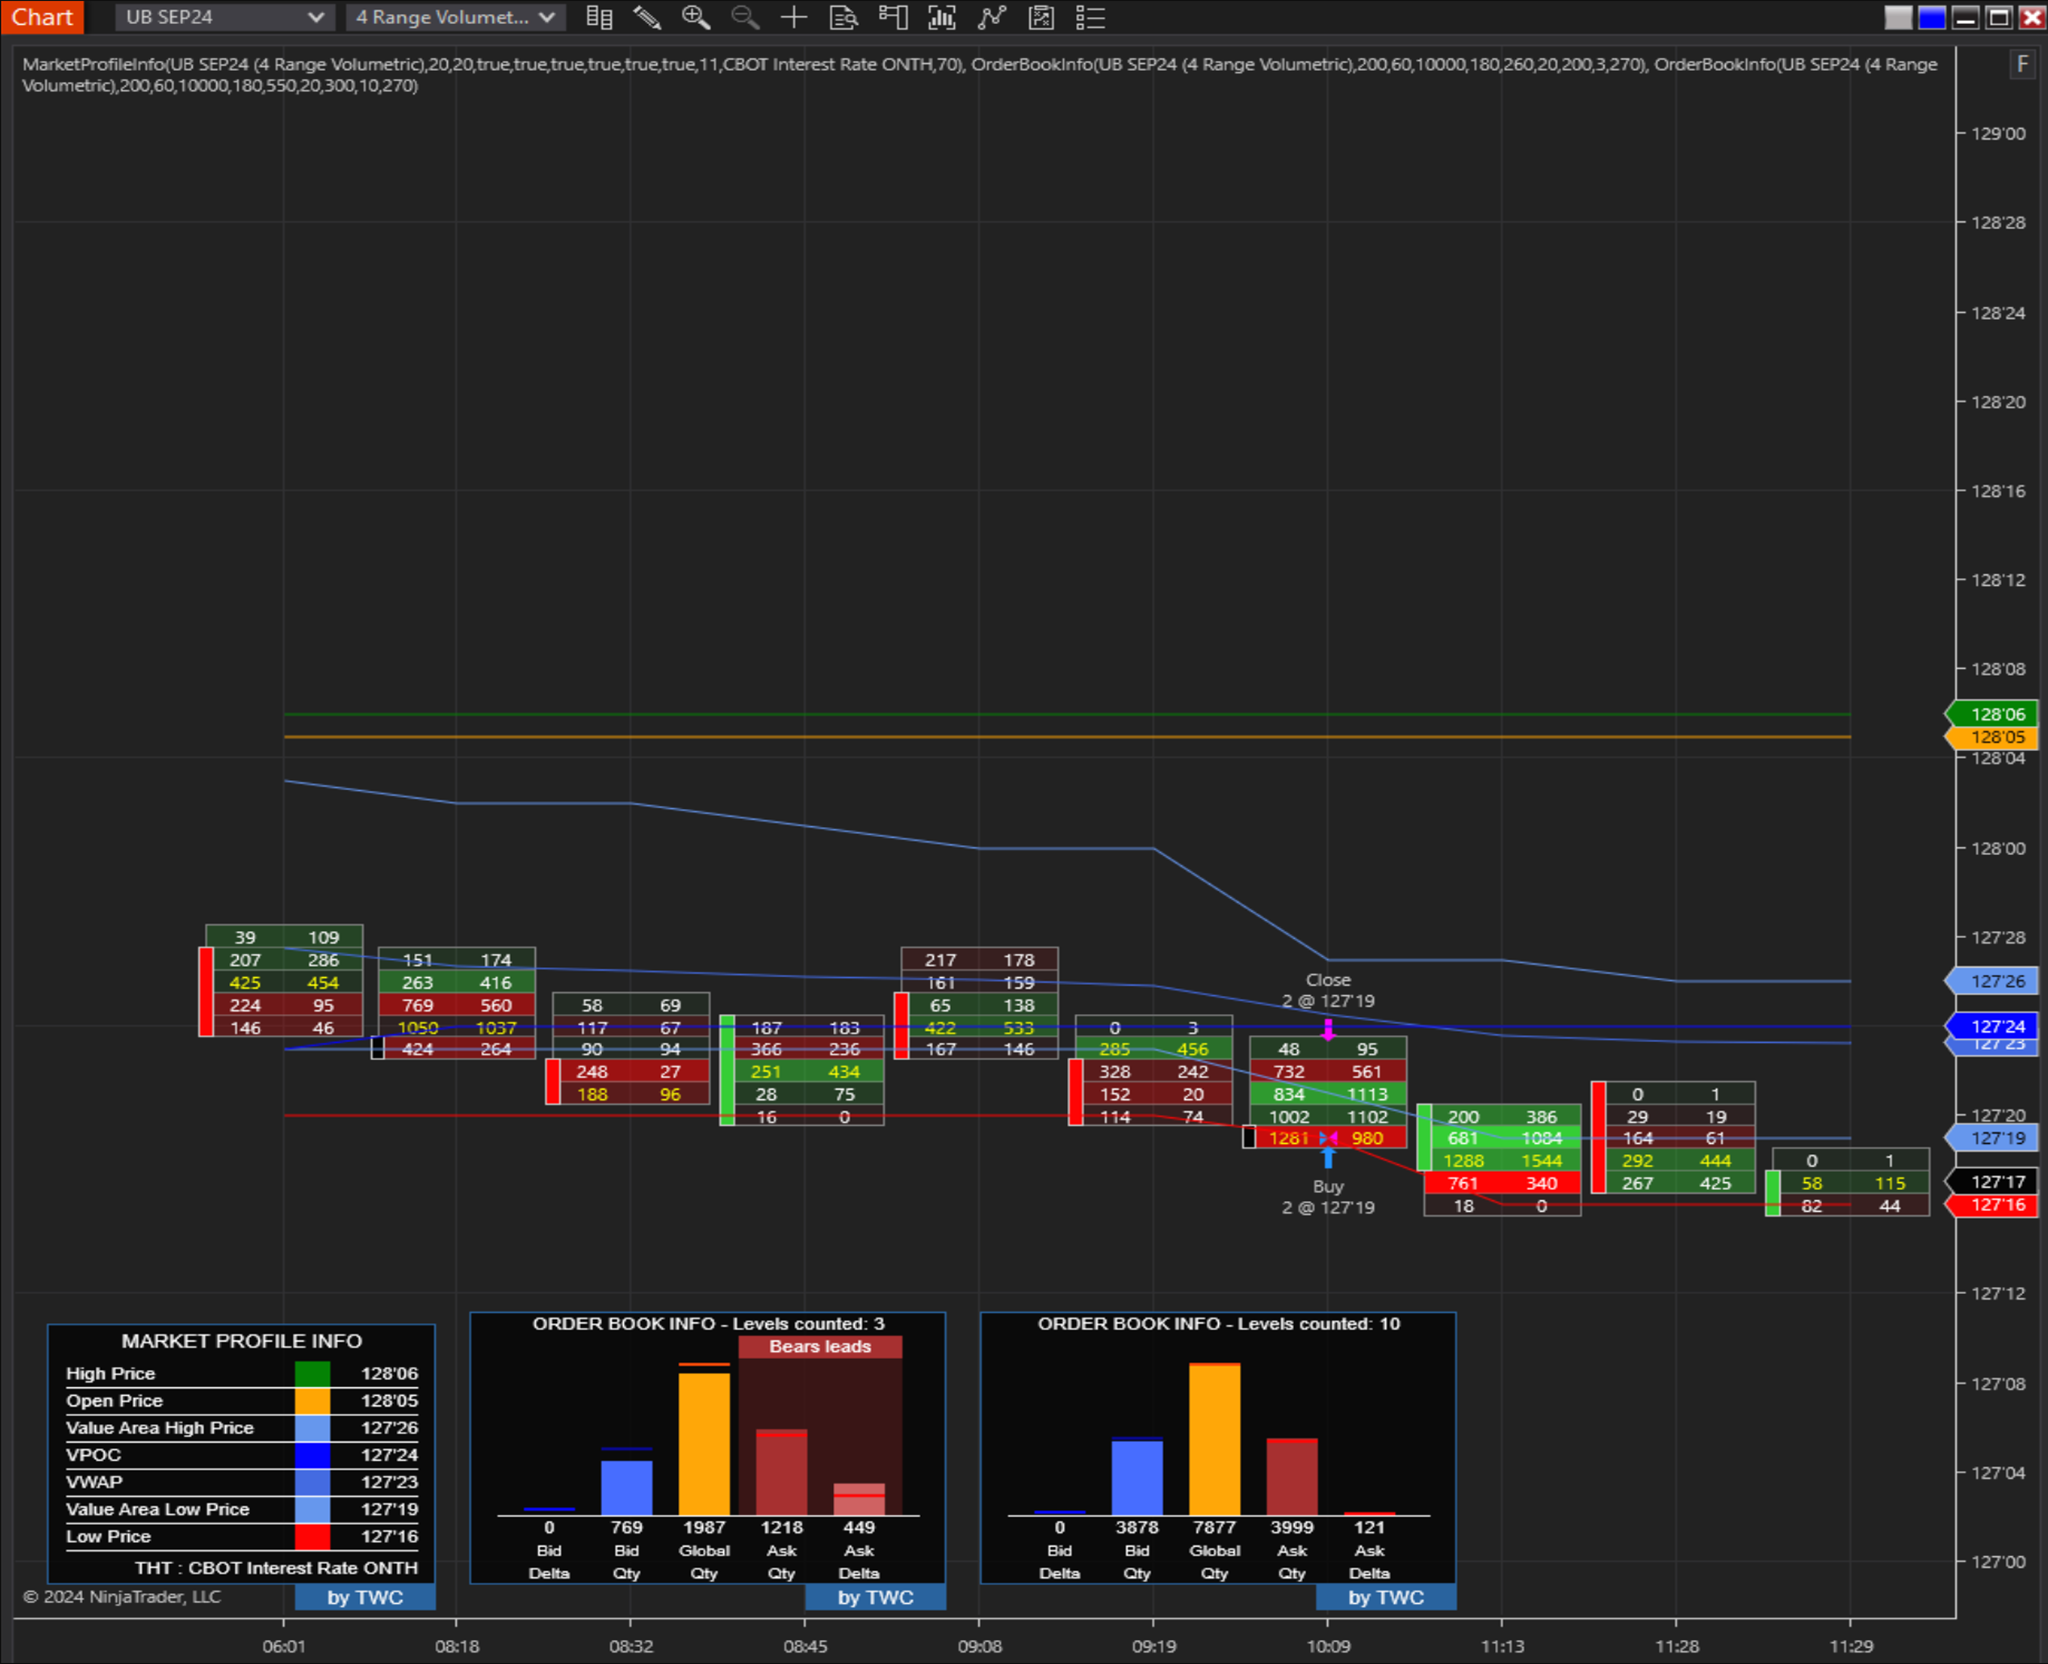
The power of TWC Market Profile Info and TWC Order Book Info. Traders gain a clear understanding of market dynamics. The Market Profile tool provides critical insights into key market points and trends, while the Order Book tool offers real-time visualization of order flow dynamics.
December 2, 2024
Mastering Sideways Markets With Auction Bars and Range Projections
November 19, 2024
Enhancing Your Automated Trading System: Key Insights from Best Pro Trade
November 14, 2024
NinjaTrader New Ecosystem Tools: October 2024 Edition
Enter Email for Updates