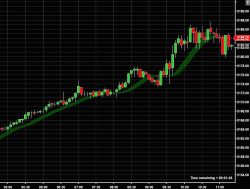
Is it a trend or a movement? Trend Ribbon uses one color to indicate an uptrend and another to indicate a downtrend. The ribbon shows trend strength and the transition of direction when the ribbon narrows and “flips.” Fully adjustable to your style and timeframe: day, swing or longer trading.
There are dozens of free RSI indicators available, but only the Ultimate RSI has all of their features and options rolled into one powerful trading tool! It also comes with the “RSI: The Day Trader’s Secret Weapon” guidebook explaining different ways to trade with the RSI. Get it now for free!
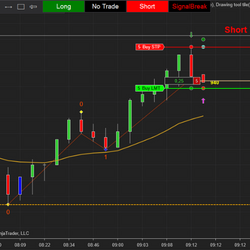
Trade two-legged pullback with this Second Entry Indicator! This is a semi-automated, two-legged pullback strategy using the built-in trading-buttons. Get alerts and your orders are placed automatically at the correct spot (no more dragging orders).
Hands Free Trader has been providing experienced and honest NinjaScript Programming solutions since 2009. Through consulting, backtesting and educational services, the goal of Hands Free Trader is to develop indicators and strategies that remove human error.
chinese
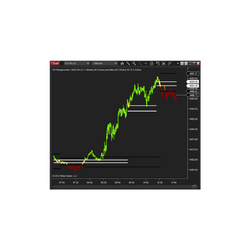
CB RangeLevels 2.0 can be used both for support and resistance and for breakout / momentum trading. The main idea is to keep you with the trend to the upside or downside. Trade in the direction of the painted bars using the middle bars as support and resistance.
Trend Meter is an emerging indicator that combines multiple traditional methods of identifying trend direction in one single indicator. The indicator provides various selections of trend algorithms and allows you to select your favorite five. The indicator will turn green for bull signals.
Get all of the most critical indicators in one package. Market Levels provides VWAP, Value Area High/Low, Point of Control, Initial Balance, Open, High, Low, Close and more helping you identify key price areas. Levels are plotted for the full session and a user customized session.
Their European open LTR targets the Nasdaq, S&P 500 and FDAX. They cater for new to expert traders. They combine a highly successful 5-minute chart trading technique with 15 & 60 minutes charts.
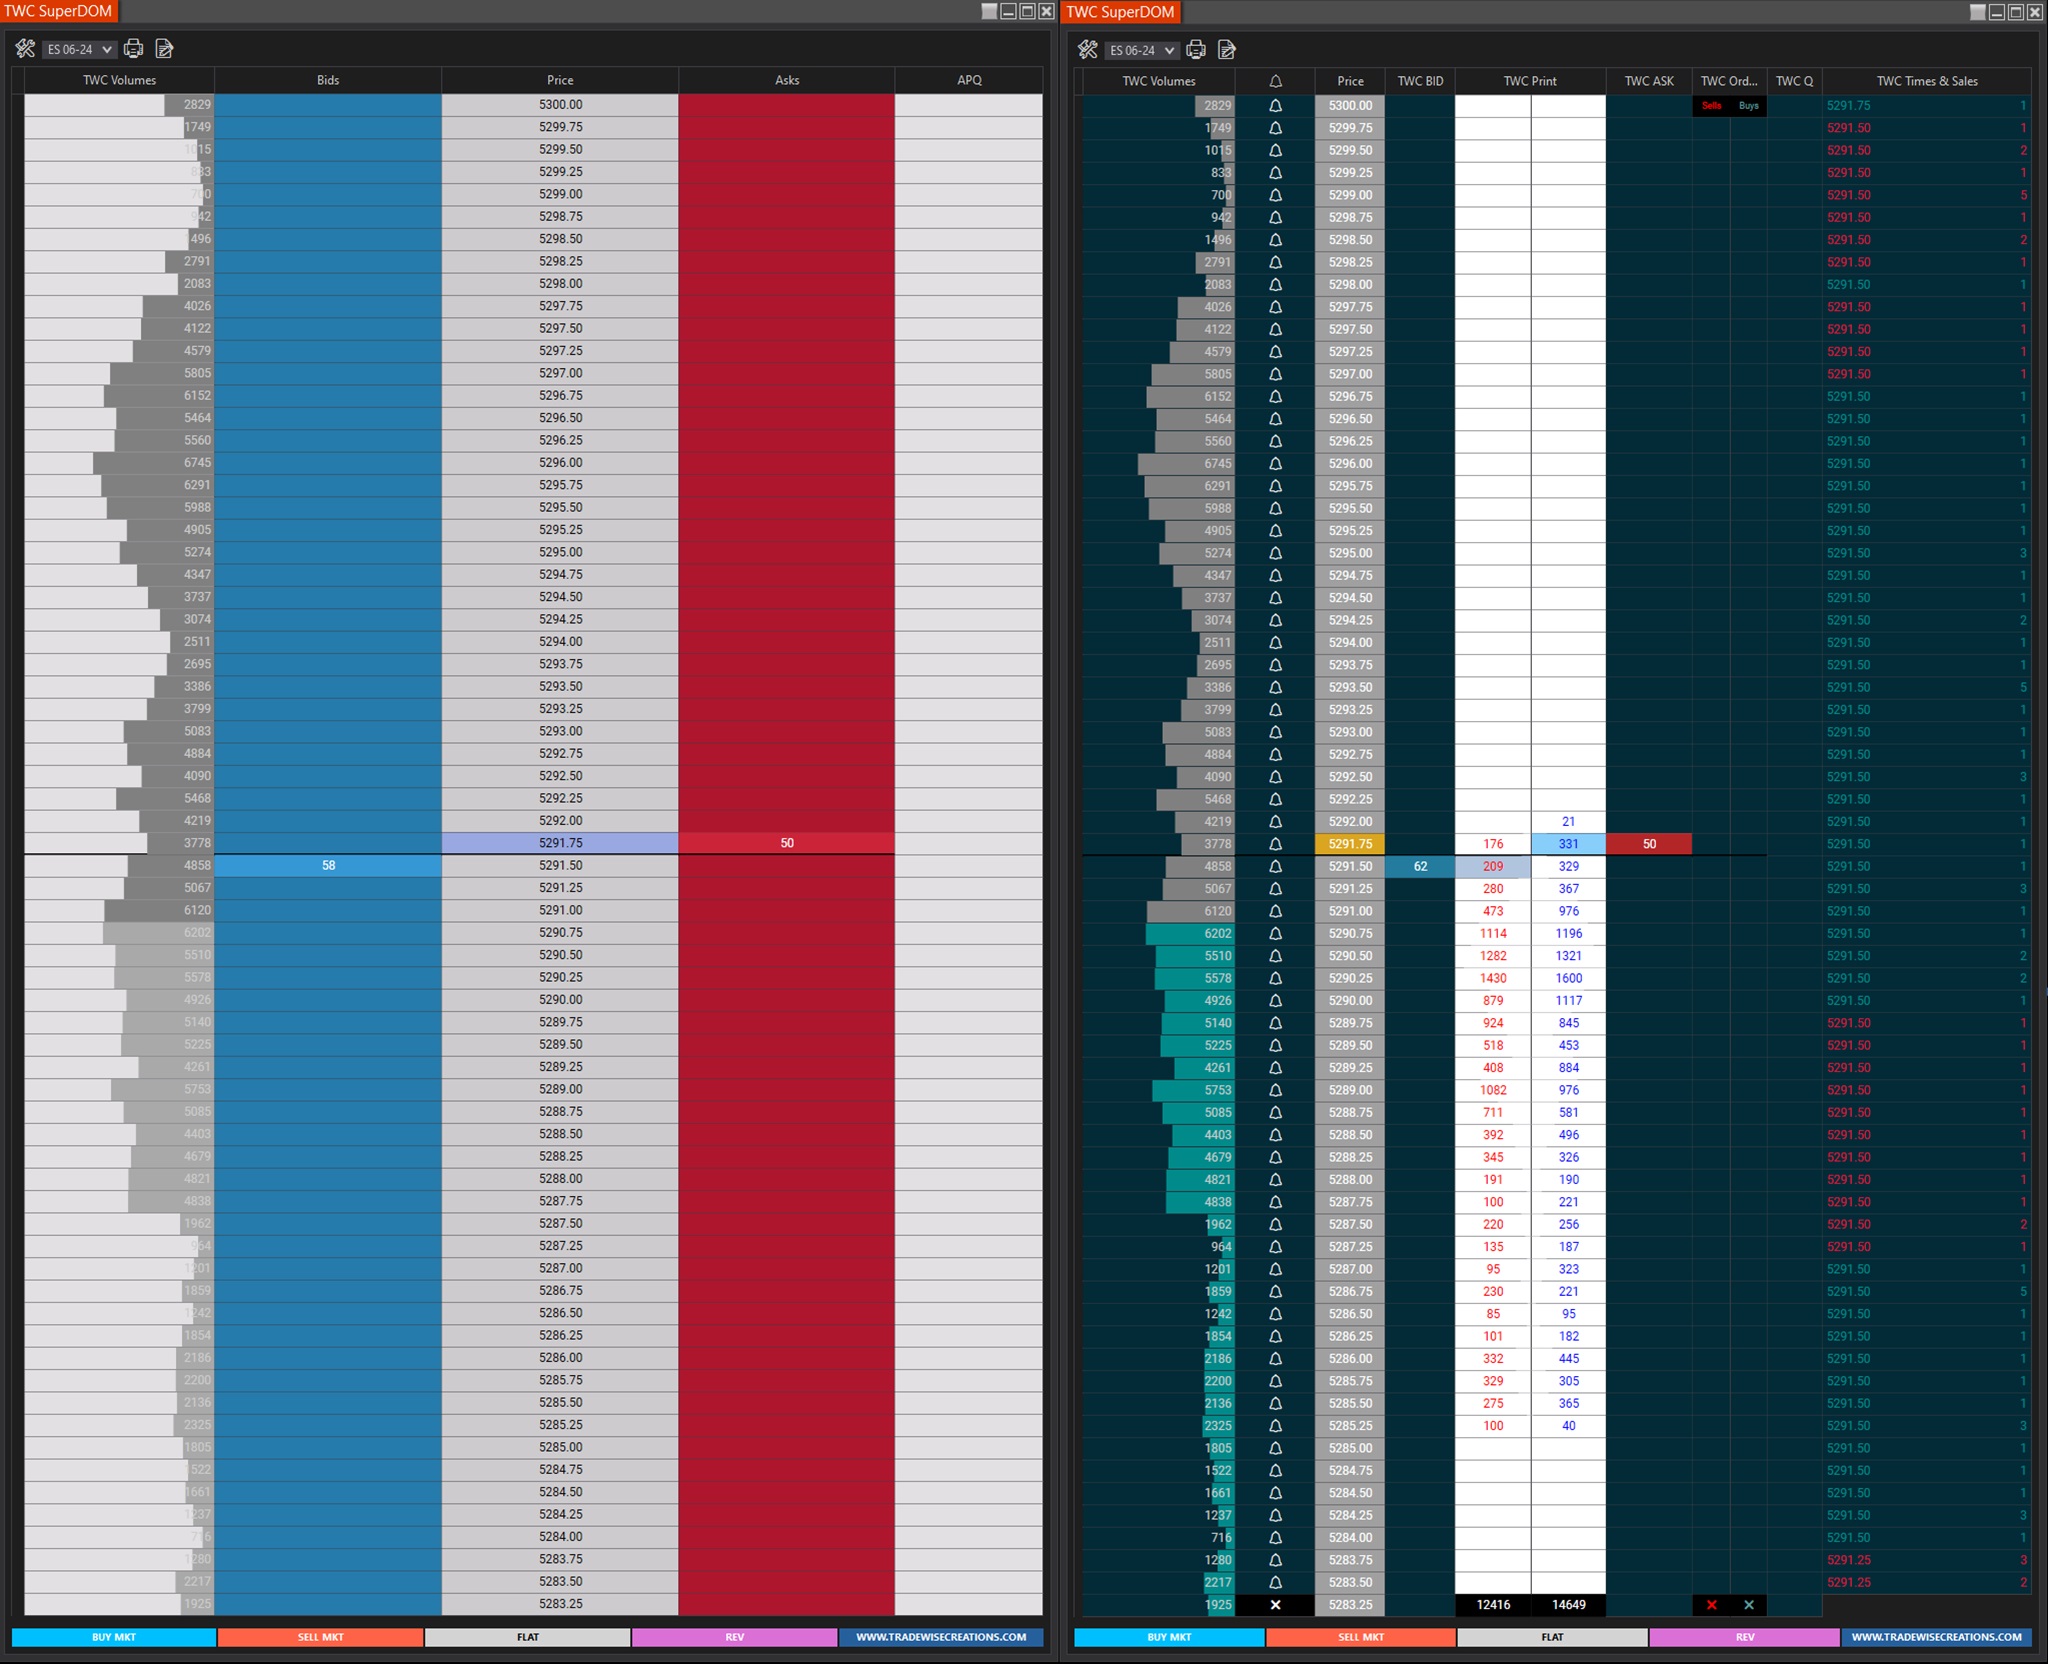
The Super Dom TWC displays a list of all buy and sell orders for a given asset, such as futures and currencies, along with corresponding prices and quantities. The team included all the essential setting and functionalities that traders need.
December 2, 2024
Mastering Sideways Markets With Auction Bars and Range Projections
November 19, 2024
Enhancing Your Automated Trading System: Key Insights from Best Pro Trade
November 14, 2024
NinjaTrader New Ecosystem Tools: October 2024 Edition
Enter Email for Updates