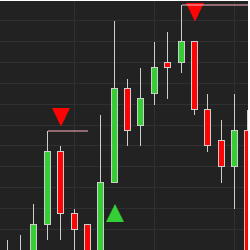
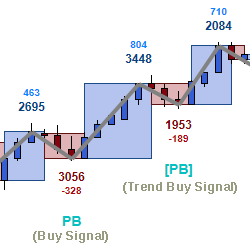
New "Ultimate A.I." indicator has it all: buy and sell signals, trend reversal signals, scalping signals, pullback alerts and stop loss placement lines. It’s multiple systems all in one. Learn more! Watch a demo tutorial by clicking the link! We also have a private chat group. Get a 5 day trial!
Try our fully-functional, ready-to-use automated trading strategy for NinjaTrader 8 at no cost for 14 days. Designed for the futures market, it has been thoroughly backtested, needs no adjustments, & is suitable for Micro/Mini markets. Full support and templates are included during your free trial.
Are you tired of only being able to trade futures manually? We have a fully Otter-mated strategy, so you can make trades while you sleep or do the things you enjoy! Try it now with our special introductory period for your first three months.
This specific bot contains both the TTT Supertrend ATR and TTT Market Structure software. Having an automated bot allows the trader to set up specific parameters and the goal with automation. The bot will enter the trade and manage it on your behalf.
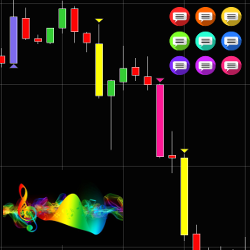
Highly customizable indicator allowing traders to track volatility without spending time staring at a screen. Candlesticks are represented by different custom colors depending on the direction of price movement & its amplitude. Notifications are also sent via email, text or by your favorite sound.
Enhance your trading strategy by visually delineating the Asia and London trading sessions on your charts. This powerful tool highlights the start and end times of these sessions, marks the high and low points, and extends these levels until the end of the New York regular trading session.
With this strategy you can optimize any parameter from the trend detection and strength filter to the entry and exit method, breakout or mean reversion, exiting at target or trailing the stop until the trend goes.
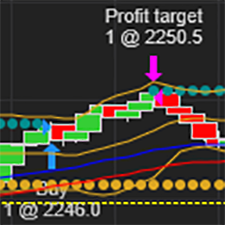
The MCumulativeDelta Indicator shows the bid / ask volume displayed in a histogram over a period. It serves to determine whether supply or demand is dominating and in control and the buying / selling pressure.
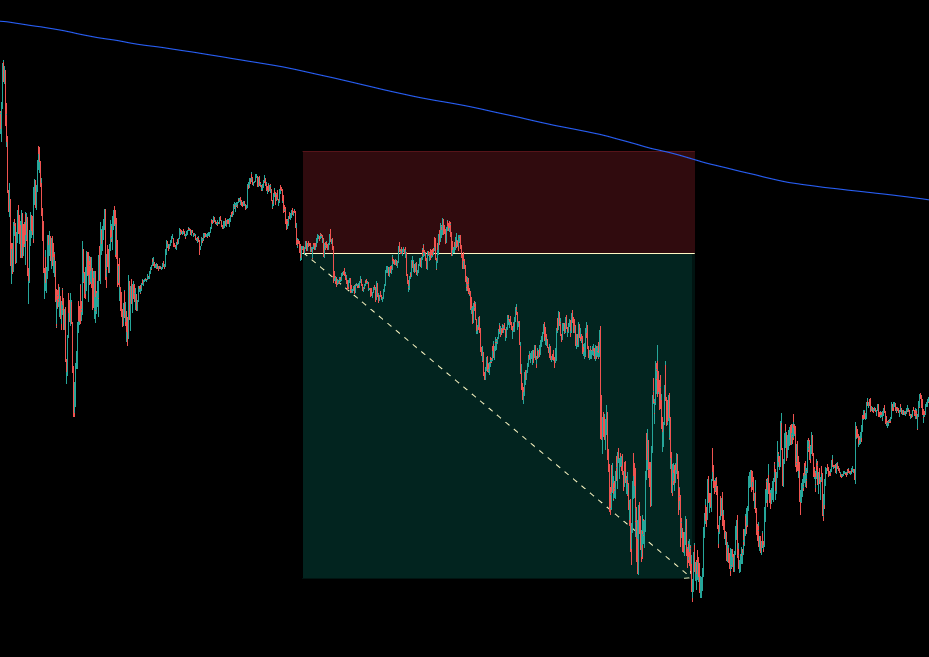
Trend Support & Resistance works great as a companion to the Trend Ribbon & Buy/Sell indicators. This indicator identifies support & resistance levels plus forecasts highs / lows. Helps you predict upcoming reversals with confidence. Adjust to your style of trading: intra-day, swing or longer.
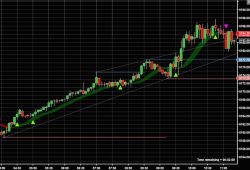
Trend Meter is an emerging indicator that combines multiple traditional methods of identifying trend direction in one single indicator. The indicator provides various selections of trend algorithms and allows you to select your favorite five. The indicator will turn green for bull signals.
December 2, 2024
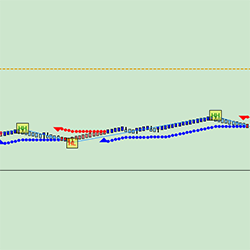
Mastering Sideways Markets With Auction Bars and Range Projections
November 19, 2024
Enhancing Your Automated Trading System: Key Insights from Best Pro Trade
November 14, 2024
NinjaTrader New Ecosystem Tools: October 2024 Edition
Enter Email for Updates