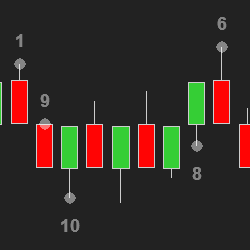
Q-GZone provides visual gap zones between the bars. Gaps occur when a significant imbalance exists between buy and sell orders. It can lead to a gap in the price as the market seeks to match these orders. The market tends to return to and fill in these gaps.
Unfinished auctions act like magnets for price. The stronger the imbalance, the stronger the pull. Optimal Unfinished Auction plots these levels and imbalances automatically on your chart. Bring order flow to your trading without over-complication! Strategy Builder compatible.
Prove you have what it takes to make money and we may fund you as a trader! We did it ourselves, we’ve done it for others, and we know we can help you, too. Learn. Get Funded. Trade! Come take the TradeDay Evaluation Challenge and get funded as a trader with our capital in live markets.
Gorilla Futures offers a complete FootPrint indicator. This indicator works on all NinjaTrader 8 licenses. FootPrint Pro™ is 100% customizable and can identify and alert traders to imbalances, delta signals, volume, and more.
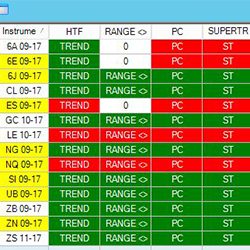
The JATS Market Analyzer Template for the NinjaTrader 8 platform has customized blackbox BloodHound solvers that show when momentum, linear regression and trend are in synchronization across multiple time frames.
If you can see when price and momentum have diverged, then you can evaluate when and where price may change directions. The SuperD indicator tracks seven different momentum oscillators. You don't even need to have any of the momentum indicators on your chart!
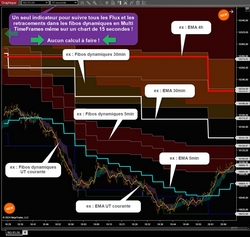
This indicator will calculate for you in multi timeframe: 4 EMA MTF + 4 “SunjoKu” MTF, the famous indicator invented by Joël Mathieu the boss of Intrad. Since version 1.5: A summary table of the status of the different TimeFrames has been included.
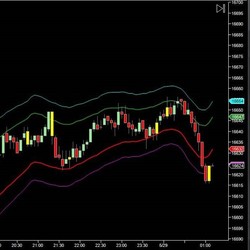
DTB Ultimate Bands is a next-generation of price envelopes that does all the heavy-lifting for traders. Once applied on a price chart, it pinpoints Overbought and Oversold areas with unmatched accuracy. Get a free trial!
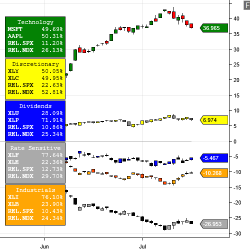
SectorJunky builds MarketCap Weighted Indexes from stock symbols with no math required. All indexes are perfectly weighted. You can also build Custom Weighted Indexes.
Get all of the most critical indicators in one package. Market Levels provides VWAP, Value Area High/Low, Point of Control, Initial Balance, Open, High, Low, Close and more helping you identify key price areas. Levels are plotted for the full session and a user customized session.
December 2, 2024
Mastering Sideways Markets With Auction Bars and Range Projections
November 19, 2024
Enhancing Your Automated Trading System: Key Insights from Best Pro Trade
November 14, 2024
NinjaTrader New Ecosystem Tools: October 2024 Edition
Enter Email for Updates