The Fibonacci Angle Fan forward plots equidistant Fibonacci trendlines from a single cast point.This provides leading edge Fibonacci Support & Resistance forecasting. Ideal for Price Action traders.Combine with traditional Fibonacci Technical Analysis methods & max tap the Fib Golden Ratio of 1.618%
Know that you’re an amazing trader but finding the funds to get started is the one thing standing in your way? At UProfitTrader, we can help! Simply choose the size account you’d like, show us what you’ve got through our unique testing process, then start turning your passion into a profession.
Get your trade information at-a-glance. Adding the Status Box on your chart allows you to see your relevant trade stats instantly.
Copy your trading from full futures (e.g., ES, FDAX to Mini or Micro Future [MES, FDXS/M]) to live accounts. Smart and easy-to-use. Combine the analysis from full futures with the risk management possible with mini or micro futures. Get started today with a two-week free trial!
A simple and versatile automated system based on one strategy. The strategy includes a technical management module, indicators, color backgrounds and a comprehensive money management module. All leases include training and support!
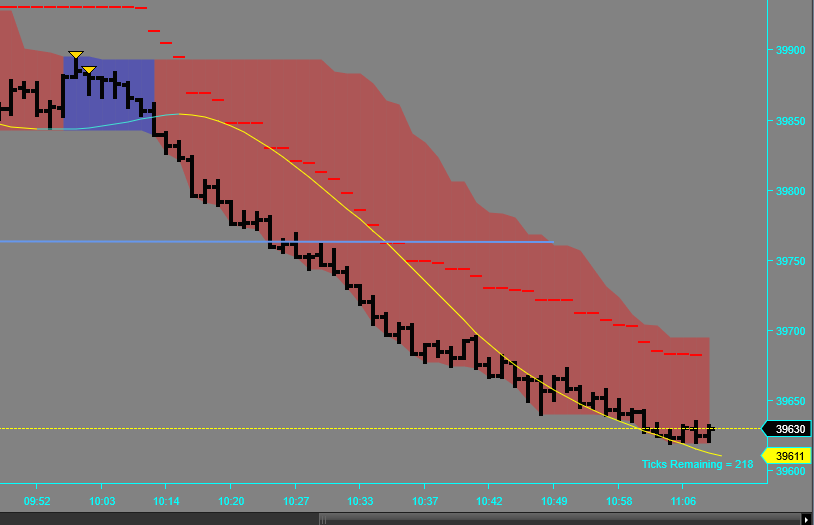
Shot Caller is a time- and volume-driven indicator, utilizing eight different data points to help identify potential short term trends in the market. Once engaged, the channel will be highlighted BLUE or RED and provide signal triangles to aid in the decision making process.
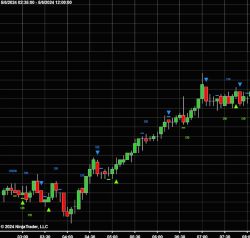
The Turn Around Signal indicator can locate and label locations of reversal / turn-arounds in price action. When combined with the proper retracement, this signal can produce great results by identifying directional changes and pullbacks. Also identifies and labels Double Bars, Doji’s and Pinbars.
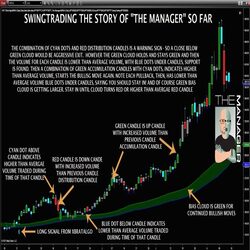
The Manager helps with simple and repeatable trade management. Using a number of tools like average volume, volume distribution or accumulation and an adjustable BIAS cloud, it can help you evaluate whether the market is reversing or just pulling back.
This free package includes Symbol Watermark, which shows the name of the symbol and time frame directly on the chart; Trader Limit, which limits trading when the daily loss level is reached; SR Dynamic Lines (dynamic resistance zones); and many other useful tools. These products are free for life.
Precision Index Oscillator (Pi-Osc) can provide trade timing signals and is a consensus indicator with some powerful variances to industry standard oscillators. At first glance, it would appear like any other oscillator, but when viewing it in tandem with other indicators the differences are clear.
December 2, 2024
Mastering Sideways Markets With Auction Bars and Range Projections
November 19, 2024
Enhancing Your Automated Trading System: Key Insights from Best Pro Trade
November 14, 2024
NinjaTrader New Ecosystem Tools: October 2024 Edition
Enter Email for Updates