NinjaProgramminSchool has been assisting traders for over 5 years in the creation of custom indicators and automated strategies at a reasonable cost. Do you have an idea you want coded or automated? Let us walk you through the process.
Trade with the best conditions in order to become an extraordinary trader, follow the risk management rules and reach your target in as little as 10 days. Once you have completed the target, we will connect you with one of our funding partners.
Next-generation support and resistance for active traders. Chartmap™ makes drawing lines on a chart a thing of the past by utilizing an innovative pattern finding algorithm to generate a heat map of powerful support and resistance. Upgrade your charts today with a 7-day free trial.
Share Service in NinjaTrader 8 is a secure file sharing platform specifically designed for the NinjaTrader 8 trading platform.
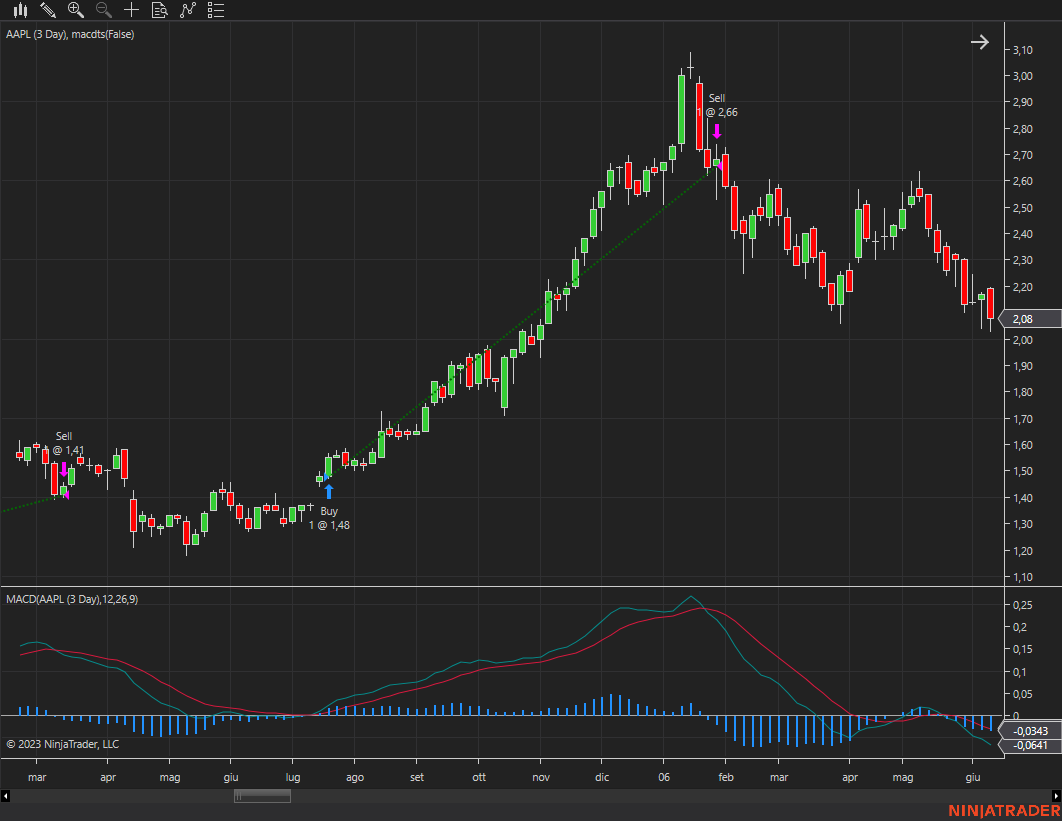
Trading system based on the MACD indicator, exploiting breakouts and trend persistence.
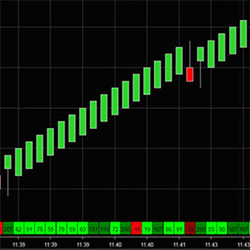
Market Delta Volume Profile is designed to distinguish if buyers or sellers are in control & to see breakdown of volume in each bar. It’s used to identify price reversal areas and look into the price action of each Renko bar to view volume profile, price & monitor order flow.
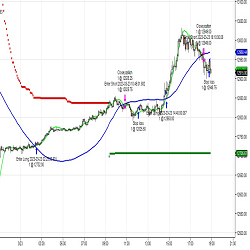
Bstrader-automatic is a powerful trend following automated trading system. It has customizable parameters, different position sizing methods, fixed size, equity percentage, atr, price percentage, ATR Trailing Stop, Market Money Scale In and Scale Out, Volatility Compass, Daily loss limit and more.
Pinnacle Quant offers custom, confidential NinjaScript programming and consulting services. Our services are offered for serious traders, CTAs, and hedge funds. Take advantage of our 20+ years of development and trading expertise. One-on-one consulting is available.
Pattern MNTrader is a fully automated trading system. Trading is conducted based on trading patterns, support and resistance lines, Fibonacci lines and trend lines. This unique combination of tools creates an innovative system of support positions with flexible settings.
Experience first-hand how Touch Zone Trading identifies opportunities & manages trades. Whether you’re trading part-time or full, you’ve got to be ‘in the zone’ to perform. Are you a good fit for the Touch Zone Trade Room? Take the trader survey!
December 2, 2024
Mastering Sideways Markets With Auction Bars and Range Projections
November 19, 2024
Enhancing Your Automated Trading System: Key Insights from Best Pro Trade
November 14, 2024
NinjaTrader New Ecosystem Tools: October 2024 Edition
Enter Email for Updates