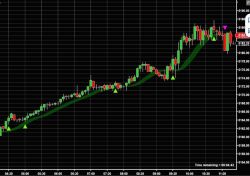
As a companion to our Trend Ribbon indicator, we offer the Trend Buy / Sell Signal. This works with The Trend Ribbon allowing you to select entry and exit points with confidence based on interpretations of the graphics. Fully adjustable to your style of trading: intra-day, swing or longer.
The algorithm works by continuously processing live data such as time & sales, volume, tape pace and tape acceleration. The algorithm performs real-time analyses, dynamically adapting to identify aggressive buyers and sellers actively influencing the market.
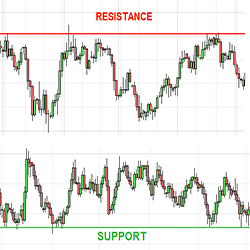
The Ultimate Pivot Points™ (UPP) Indicator Package is the most advanced and extensive collection of “Pivot Points” Indicators available. It includes every “Pivot Point” method along with several innovative features — making it one of the most complete Support/Resistance indicators on the market!
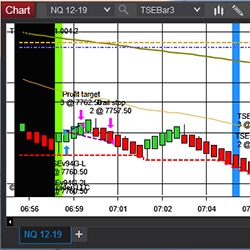
Traders Strategic Edge ™, or TSE, is a fully automated trading system that trades automatically once configured by the user. For details visit Rhino Software’s website and see the product in action. Take advantage of the 30-day paid trial and check it out for yourself.
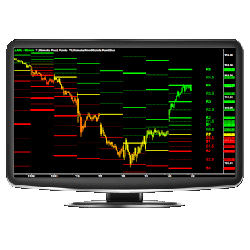
See when & where aggressive traders act and track these levels over time with EDGE Zones. emoji trading's order flow analytics track real-time supply & demand. Is it continuing with potential to hold, or exhausting with potential to break? Get started with a free 7-day trial today!
In this course you will learn how to trade the following chart patterns: Trendline strategies, candlestick patterns, chart patterns, Elliot Wave Theory, harmonic patterns, risk management, trading plan, trading psychology and more.
Plots chart and/or synthetic support and resistance lines from a higher time frame.
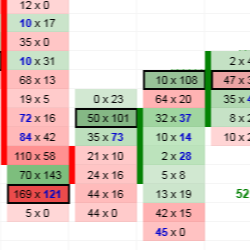
TD Order Flow features Heavy Volume Zones, multiple Volume Nodes, Imbalances, Unfinished Business, a built-in Trades Filter and a separate Cumulative Delta indicator as a bonus. It works with both futures and forex and includes 12 hours of Order Flow video training.
The VTP was created to provide Veterans with an introduction to financial markets. Stage 1 provides the basics of how to analyze, trade, manage risk, and improve as a trader. All stages of the VTP leverage the attributes of great traders and veterans: Process, Discipline, and Self-Awareness.
There are dozens of free RSI indicators available, but only the Ultimate RSI has all of their features and options rolled into one powerful trading tool! It also comes with the “RSI: The Day Trader’s Secret Weapon” guidebook explaining different ways to trade with the RSI. Get it now for free!
December 2, 2024
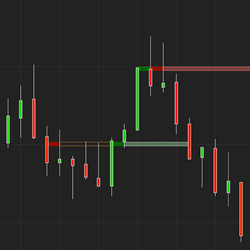
Mastering Sideways Markets With Auction Bars and Range Projections
November 19, 2024
Enhancing Your Automated Trading System: Key Insights from Best Pro Trade
November 14, 2024
NinjaTrader New Ecosystem Tools: October 2024 Edition
Enter Email for Updates