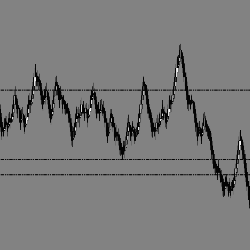
It is not always easy to quickly determine the size of a bar by looking at the price axis. BarSizeCounter allows you to instantly observe the size of the bar and how far the current price is from its high and its low.
EPyFClimaxVolume is an indicator which designates climax areas within intraday charts. It also identifies important entry & target levels for day trading. You can customize the indicator levels within each chart.
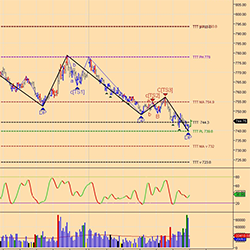
The TTT Lines Indicator extracts the information from the daily TTT E-Book report & plots the data directly on NinjaTrader charts. Quickly identify the TTT support and resistance levels plus more!
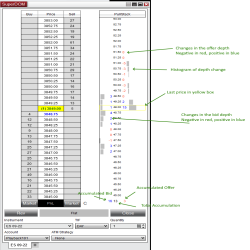
The Pull Stack Super DOM column shows you changes in the order book. There are several modes to this indicator to help give you a nuanced view and find the state of the market at each price level.
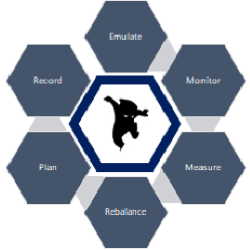
The Tradelytics platform enables investors, wealth managers and analysts to emulate and execute portfolio management with the live market data for both simulated and live portfolios. The portfolio is measured for risk and reward. Users anywhere can record fundamental and technical analyses.
Bell-VSA is designed to consolidate both fundamental and technical analysis into a solitary approach. The Bell-VSA features Volume Spread Analysis Signals, volume profile & customizable colors.
Storm Eye enhances trading accuracy by leveraging fake breakouts to pinpoint optimal entry points, offering a sophisticated and reliable method for navigating market turbulence. It operates through a three-step process: Identifying a breakout, detecting a breakaway, and generating a signal.
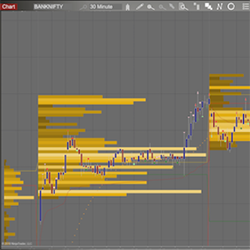
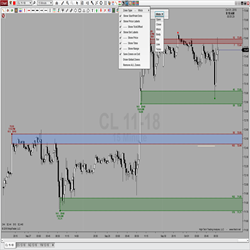
Creating, displaying & saving levels of interest could not be easier! Simply double click above or below any bar to automatically add or remove zones. This features 8 unique Zone Types, a right click context menu & toolbar icon for simple configuration, and is global drawing & template capable!
High performance, fully-automated night and day trading for NQ and MNQ. The VX9 wakes up before sunrise and finds the best trading opportunities in the morning twilight. Built from scratch to be a true day trading system, the VX9 offers simplicity and performance.
Momentum indicator
December 2, 2024
Mastering Sideways Markets With Auction Bars and Range Projections
November 19, 2024
Enhancing Your Automated Trading System: Key Insights from Best Pro Trade
November 14, 2024
NinjaTrader New Ecosystem Tools: October 2024 Edition
Enter Email for Updates