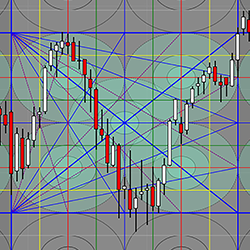
The Samri Math Diamond Grid is a drawing tool which is applied by drawing a square on a chart. The tool then automatically displays graphic elements which are based on calculations from the methodologies of Gann & Murrey.
The Price Hacker introduces techniques outlined in the manual to promote the creativity of the user. The hacker section is for identifying sudden shifts in supply and demand, the staircase is used to pinpoint a break in a trend, and the sequence section evaluates the changing of the trends.
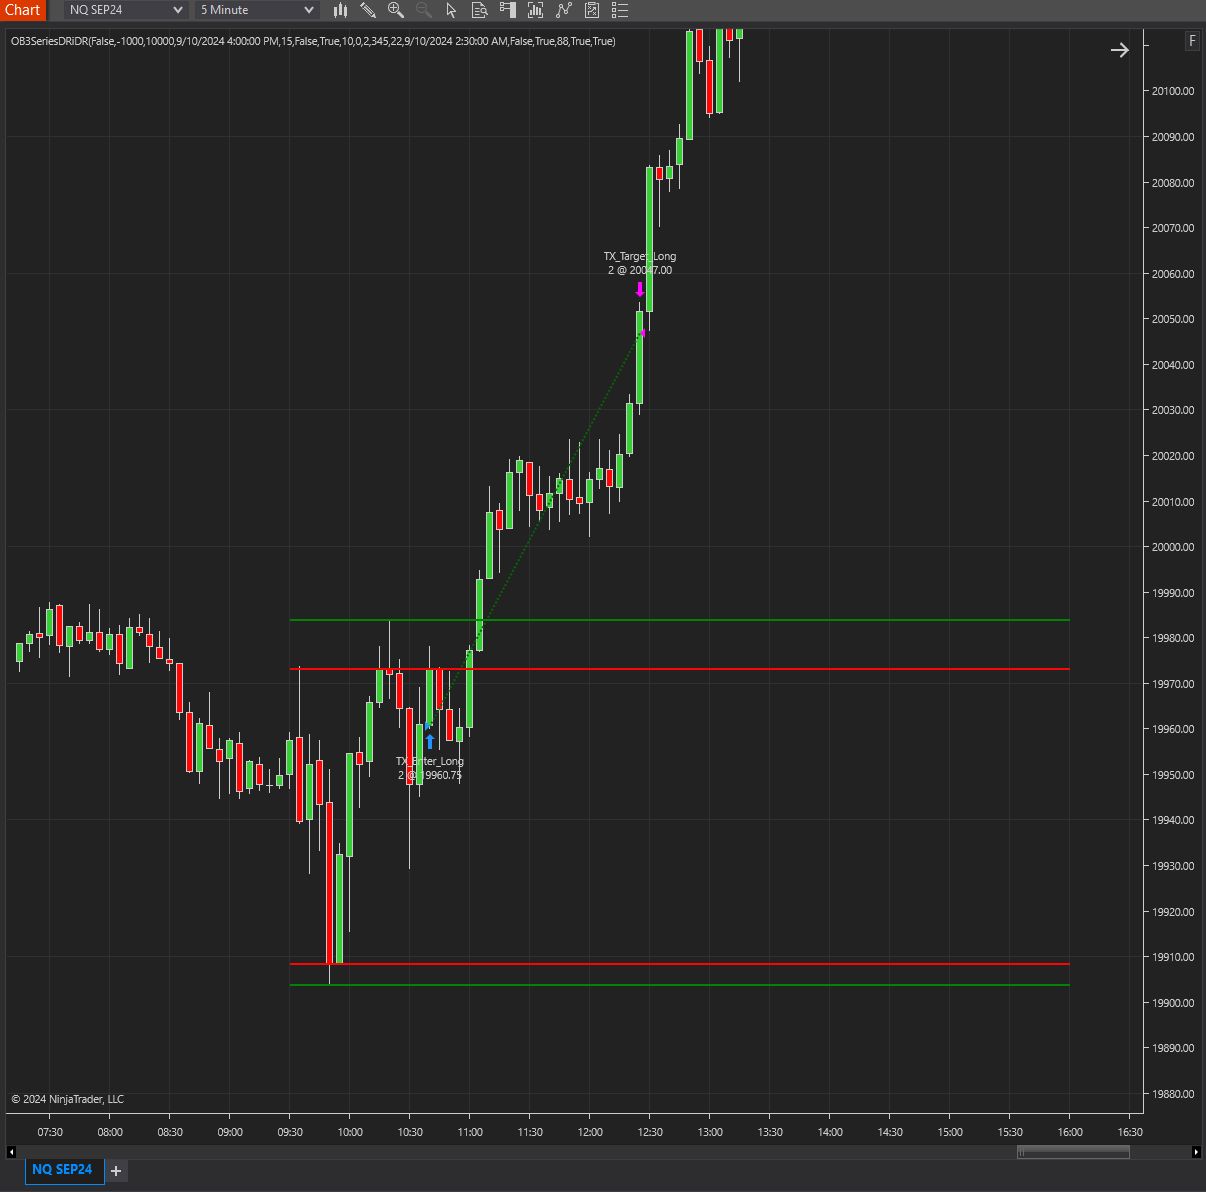
The DR/iDR strategy works by calculating the high, low, and close prices during the critical first hour of trading (9:30–10:30 AM) to determine the Daily Range. It then generates Implied Daily Range levels based on this data, providing clear markers for potential breakout or reversal zones.
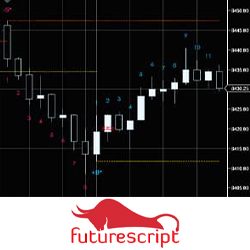
Use our Auto-Swing Pattern Finder to help find potential market patterns! Swing Pattern Trading is a methodology that utilizes the recognition of specific price patterns and the alignment of exact Fibonacci ratios to determine probable reversal points in the financial markets.
The BG Levels indicator displays institutional buy and sell levels - where the “smart money” is buying and selling - and where they are exiting. The premise is to buy at a cross of the Level Up line (to the upside) and exit your long position at the Target line (to the downside).
The iCinDER™ Cycles VF (Velocity Force) indicators allow for a quick validation of analysis, thus speeding up reaction time to market movement's bias. The analysis is based on velocity force of the instrument being analyzed.
Join the PFA Community and get the Supply Demand Trading Course, Software licenses, forum access, live training room and more! Monthly, yearly & lifetime license packages available!
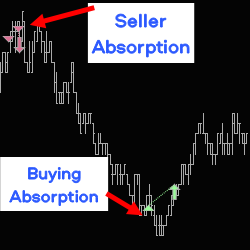
Absorptions are announced in real time with audible alerts and/or drawings on the chart. It also analyses backticking following absorptions. Adapt your trading zone live, with a toolbar on the chart. Strategy builder compatible.
Master back-testing in algorithmic and quant trading with their dual course bundle. Learn essential techniques and advanced methods to optimize your trading strategies. Validate and optimize your trades with systematic, quantitative approaches. Start building your trading edge today! Sign up now!
This incredibly innovative suite of Bollinger Bands and divergence indicators shows selected, plotted ‘dots’ with a broad selection of Bollinger Band combinations. You can choose from seven indicator combinations!
December 2, 2024
Mastering Sideways Markets With Auction Bars and Range Projections
November 19, 2024
Enhancing Your Automated Trading System: Key Insights from Best Pro Trade
November 14, 2024
NinjaTrader New Ecosystem Tools: October 2024 Edition
Enter Email for Updates