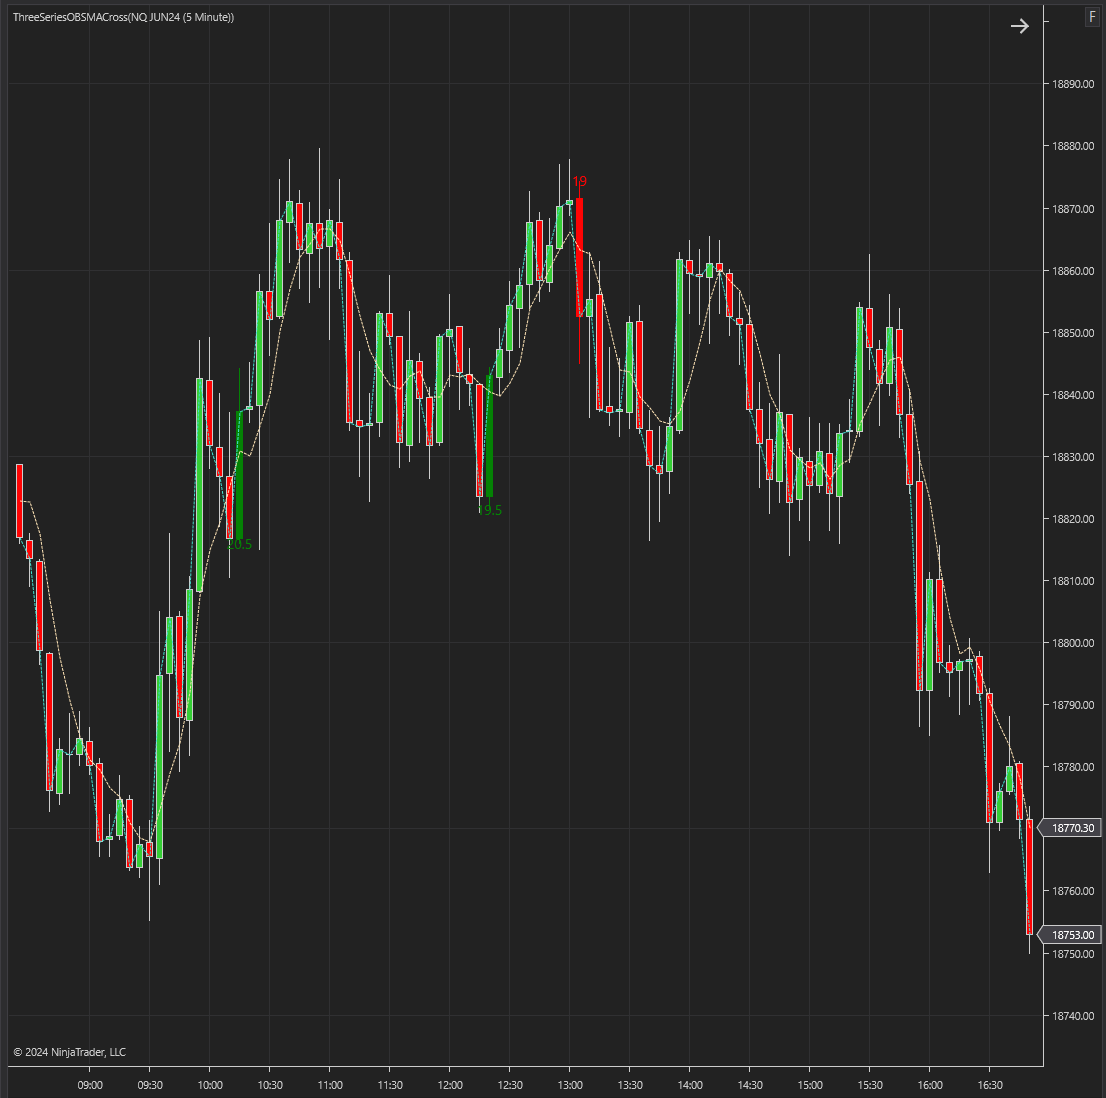
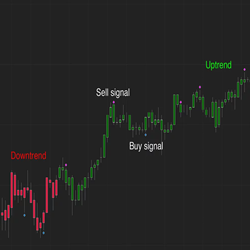
This Indicator is a sophisticated tool designed to help traders identify and capitalize on bullish and bearish market trends. By combining Simple Moving Averages (SMA) and engulfing pattern detection, this indicator provides clear and actionable signals for entering and exiting trades.
3 Day Cycle (a.k.a. Taylor Trading Technique) was invented by George Taylor. His core premise was that the market is manipulated in stages. Now traders have access to an “Electronic Trading Book” via spreadsheet emailed daily.
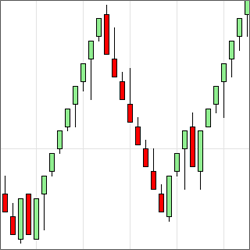
The Lucrum Vision Renko Bar reflects the actual price of the underlying instrument so you can be confident in its ability to accurately represent true price. Get accurate Renko charting for both live and backtested trading environments.
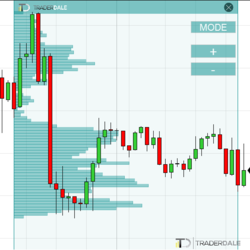
TD’s Flexible Volume Profile helps to reveal institutional trading activity and identifies the strongest support and resistance zones. The use of tick volume data makes it extremely precise, pointing to potential entries. It is easy to learn and simple to use.
The Q-Indicator provides visual signals of overbought or oversold conditions in the market. Users can enter trades manually or use the indicator in an automated system to take advantage of the various market imbalances.
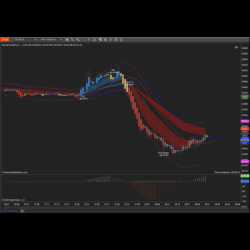
Enhance your trading with Trade With The Bull Software. Optimize your strategy using advanced algorithms and robust indicators for precise entry and exit signals. Key features include advanced technical indicators, customizable parameters, real-time market data integration, and more.
David Misselhorn is a software developer with over 30 years of development experience in trading clients, market data and order-execution software. He writes indicators and strategies for individuals wishing to automate their trading and analysis activities.
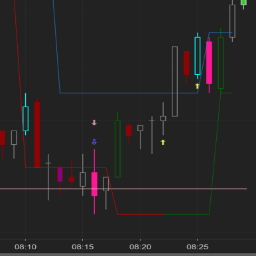
This ultimate package provides high-quality, reliable signals with quick, easy, and precise order entry. Agile Piranha Scalping generates rapid, high-frequency signals, swiftly executed within a small market range. It elevate your scalping with efficiency and reliability.
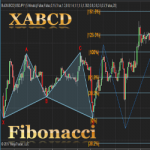
XABCD 5-point chart patterns are very common and popular in technical analysis. As the name suggests, XABCD pattern has 5 points and 4 legs formed by those 5 points. The concept of the XABCD 5-point pattern can be understood on a chart.
QuantCycles harnesses artificial intelligence (AI) and machine learning (ML) for superior predictability, stability and chart analysis. With refined algorithms using advanced Fourier cycle analysis, Hurst cycles and W.D. Gann theories, this latest version delivers exceptionally accurate forecasting.
December 2, 2024
Mastering Sideways Markets With Auction Bars and Range Projections
November 19, 2024
Enhancing Your Automated Trading System: Key Insights from Best Pro Trade
November 14, 2024
NinjaTrader New Ecosystem Tools: October 2024 Edition
Enter Email for Updates