This strategy uses a collection of moving average and oscillator indicators to identify trends in the market. The use of limit orders for entry and exit orders get's you the best price possible when buying or selling. This strategy uses both long trades and short trades.
The FiReZ Trading Strategy is an original and modern refinement of Fibonacci technical analysis. This Fibonacci trading strategy may be the last strategy that you'll need to learn. Stop making trading complicated and learn how to analyze and trade in a simplified, structured, and repeatable system.
Ichimoku MNTrader is a fully automated trading system. Trading is based on the Ichimoku Kinko Hyo indicator, patterns and zigzag to filter out false signals and build more accurate analysis. It uses Renko charts and is suitable for all futures and Forex trading instruments.
The Smart Momentum NinjaTrader Indicator tool has a unique design compared to other momentum indicators. It uses an averaging mechanism that analyzes the cycle and adapts to it. This results in a momentum plot that is simultaneously smooth and sensitive.
View stops and targets on your screen based on the ever-changing average true range.
Join this team of professional traders and mentors as they identify trades in real time (US / open & close NQ & ES).
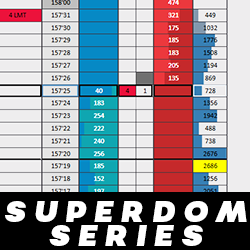
6 highly customizable and powerful columns (plus the SuperDOM utilities) are available for the NinjaTrader SuperDOM. Create the ultimate SuperDOM - now with trading capabilities, unprecedented performance, and all the features you expect from a professional set of DOM columns!
The BG Levels indicator displays institutional buy and sell levels - where the “smart money” is buying and selling - and where they are exiting. The premise is to buy at a cross of the Level Up line (to the upside) and exit your long position at the Target line (to the downside).
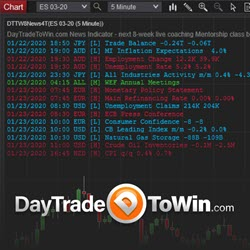
Download our FREE news indicator to see upcoming/scheduled financial news events plotted right on your chart. News events can cause sudden volatility and losing trades. Use this tool to stay informed. Watch the "Trading the News" video: https://daytradetowin.com/educational-trading-videos
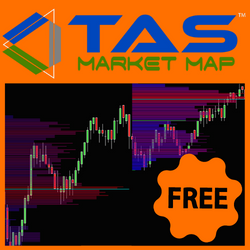
100% FREE - The TAS Market Map Indicator delivers the most visually appealing customizable market profile tool for traders. Its color-coded sideways histograms clearly reveal volume at price, value areas (red zones), master point of control lines (aqua lines), gaps and congestion.
December 2, 2024
Mastering Sideways Markets With Auction Bars and Range Projections
November 19, 2024
Enhancing Your Automated Trading System: Key Insights from Best Pro Trade
November 14, 2024
NinjaTrader New Ecosystem Tools: October 2024 Edition
Enter Email for Updates