Watch price action at daily support and resistance levels in real time! Use the hourly open and EMA 20 as dynamic support and resistance. Detect reversals, trend attempts and breakout setups on the first three bars of the day. Get started with a free 30-day trial now!
The Volume Weighted Average Price (VWAP) tells traders the average price for all transactions executed during a trading session, such as the current day, week, month or quarter. Many institutional traders execute based on the VWAP, so it is an important price benchmark to control transaction costs.
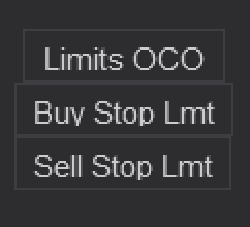
Bars Edge Trader Button and OCO Timer pack for NinjaTrader 8. An easy fast solution to apply Limit Orders to your Chart Trader. Included are three timers for adding OCO Limits entries throughout the day to catch a news cycles semi-automatically.
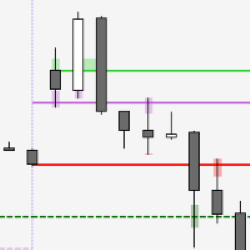
Plots chart and/or synthetic support and resistance lines from a higher time frame.
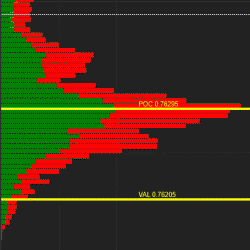
itcMarketProfile is a highly customizable indicator for monthly, weekly and daily market profile. It draws the profile and important levels like POC, VAH and VAL. The value area volume percentage is adjustable, and the indicator can display historical values of POC, VAH, VAL as an option.
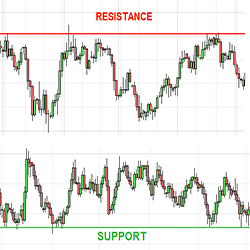
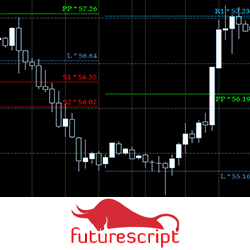
The Pivot is based on the classic pivot point indicator with a few twists and innovations. These levels present a very straightforward approach to buying and selling critical points as the session plays out using good risk/reward disciplines.
Predict the ultimate stop level using the sophisticated NSR Triple STX, which performs over a million calculations per bar. Measure the trend strength using the non-arbitrary Ocean math with the BTX indicators. Includes Ocean Classic. Sign up for a 30 day free trial!
TradeFoxx is an automated trading software designed for the NinjaTrader Desktop platform, version 8. It supports trading in Forex, Futures, and Equities, and offers full automation with time frame control. A free 30-day trial is available, allowing you to test the product before making a purchase.
Get all of the most critical indicators in one package. Market Levels provides VWAP, Value Area High/Low, Point of Control, Initial Balance, Open, High, Low, Close and more helping you identify key price areas. Levels are plotted for the full session and a user customized session.
Helping people to see beyond the price action – to see how market participant and their effort on the candlestick. Market participant like market buyers and sellers, and their effect on limit buyers and sellers by combining foot print chart and market profile.
December 2, 2024
Mastering Sideways Markets With Auction Bars and Range Projections
November 19, 2024
Enhancing Your Automated Trading System: Key Insights from Best Pro Trade
November 14, 2024
NinjaTrader New Ecosystem Tools: October 2024 Edition
Enter Email for Updates