A powerful self-study program that will help you learn the core principles and implementation of the Hunt Volatility Funnel Method with a total of 18 hours of material, topic by topic, alongside case studies and live trading webinars.
Quaderr offers 12 High Quality indicators totally FREE. Please click the link below to get yours!
The StockCalcValuation indicator displays a fundamental valuation for the company you are examining. At StockCalc we value 8000 companies each night using 6 valuation models or data points and determine a Weighted Average Valuation from these calculations for display. Get your free trial now!
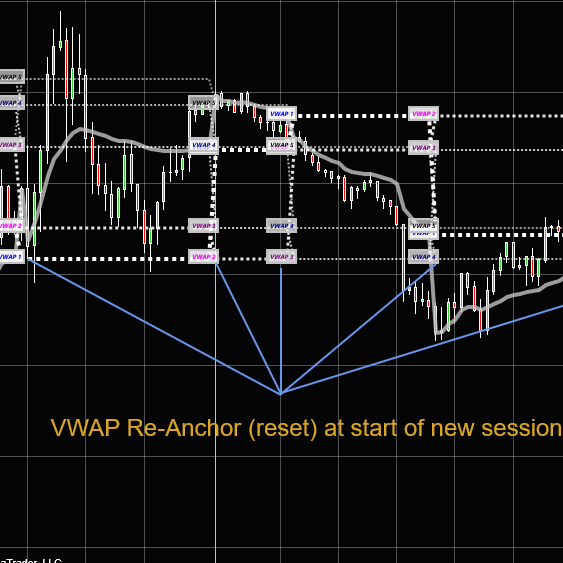
The Volume Vector tool creates automatic volume profiling of price action swings. Increase trading consistency and see exactly where trades have been initiated!
Advanced Wyckoff Course: Learn advanced concepts of the Wyckoff Method in a simple way. This will teach you unique concepts that will make you an expert in the Wyckoff methodology and take your analysis and trading to the next level.
Kwikpop 6 brings the trend of any market into clear view utilizing a combination of 26 proprietary indicators to find potential entries and exits. The Dynamic Power Tools are designed to remove the noise from charts and clearly show the trend.
Trading coach with volume and price indicators.
PFAZoneSuite is advanced supply and demand trading! Indicator package includes automated volume zones, volume profile, order flow analytics, trend lines, fibonacci retracements, market structure, trade data box and more! Compatible with NinjaTrader 8. Click here for a free demo!
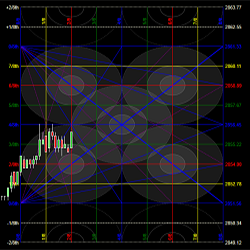
Samri Math RY Intraday is a purely PRICE-based indicator for traders who use Murrey Math methodologies. It works not just with time-based charts (day/minute/second), but also with other chart types such as Renko, Range, Volume and Tick. Multiple algorithms for calculating price levels are included.
Increase your trading confidence by scheduling your one-on-one performance coaching and mentoring session with one of our seasoned and experienced traders. Beginner, intermediate or advanced topics can be discussed with our Certified Mental Performance Coaches.
December 2, 2024
Mastering Sideways Markets With Auction Bars and Range Projections
November 19, 2024
Enhancing Your Automated Trading System: Key Insights from Best Pro Trade
November 14, 2024
NinjaTrader New Ecosystem Tools: October 2024 Edition
Enter Email for Updates