Automatic ATM Entry Assistant (AUTOBOT) can be used with our indicators and others using native Ninjatrader 8 Arrows or Triangles on the chart. Set up complex entry parameters without coding. Continue to our product page to see the 25-minute video of how it works.
No subchart indicators or additional time frame charts are required to see when price becomes overbought or oversold. This helps the trader identify weakness in an uptrend or strength in a downtrend to anticipate a potential change in price direction. An award winning "heads-up display" indicator!
Discover top trading opportunities for US stocks, Wyckoff method analysis in US indices futures, Gold, Silver, market internals, and more to look for “time sensitive development” trading opportunities. Discuss your trading plans and past trade reviews to sharpen your price action trading skills.
Automatically snap trade execution screenshots or take a snap at a set bar interval. SnapMyTrade assists traders with journaling and post trade analysis.
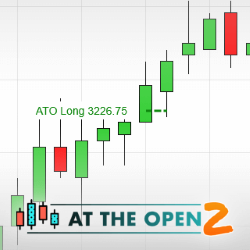
Use the ATO 2 indicator and learn how to take advantage of big price action moves right after the market opens. This is our flagship day trading method which we have improved over the years. Come see what put us on the map. Package includes both video and live training.
Turn your ideas into code! We work 1-on-1 with you to understand your needs and engineer a quality software solution that meets them. Automated strategies, indicators, data analytics, portfolio supervision – let us know your needs, we’re here to make it happen. Get in touch with us today!
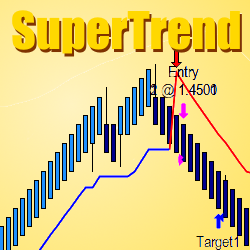
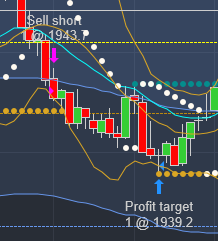
The TIS_Supertrend Indicator is a tool designed to trade volatile markets. The indicator produces 2 types of signals, a trend change arrow each time a trend line is broken and a pullback entry subsequent to the trend change. Download the TIS_SuperTrend today!
Pinnacle Quant offers custom, confidential NinjaScript programming and consulting services. Our services are offered for serious traders, CTAs, and hedge funds. Take advantage of our 20+ years of development and trading expertise. One-on-one consulting is available.
Ocean Theory considers all time frames simultaneously, and lets the market tell you which ones have the most significance, since that changes with time. Determine trend, pinpoint end of counter-trend moves for optimal entries, and apply natural moving averages. Sign up for a 30 day free trial!
Elevated trading with precision and autonomy. Trade smarter, hands-free! Does not activate everyday as it is looking for specific market opportunities.
December 2, 2024
Mastering Sideways Markets With Auction Bars and Range Projections
November 19, 2024
Enhancing Your Automated Trading System: Key Insights from Best Pro Trade
November 14, 2024
NinjaTrader New Ecosystem Tools: October 2024 Edition
Enter Email for Updates