The market efficiency is an oscillator-based gauge which monitors bid and offer information in an adaptive sequence. By monitoring such action, the user will be able to determine efficient (directional) or inefficient (turning) price action.
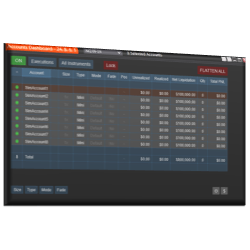
Duplicate Account Actions is the premiere NinjaTrader trade copier solution, built to keep all your positions and orders across all accounts in sync at all times. Finally, eliminate stress and challenges related to issues from other trade copier solutions!
Improve Your Trade is a fully-automated trading journal which records and tracks every trade you make automatically. It even adds screenshots of your trades, allowing you to focus on the important things like analyzing your trading performance!
This is an introductory class that is perfect for beginners. It covers a multitude of topics including Technical Analysis and trading with custom indicators. Learn through one-on-one and group live zoom classes daily.
If you can see when price and momentum have diverged, then you can evaluate when and where price may change directions. The SuperD indicator tracks seven different momentum oscillators. You don't even need to have any of the momentum indicators on your chart!
BitBlockBridge for Bybit Traders is a NinjaTrader add-on offering real-time cryptocurrency chart data, supporting both minute and tick charts. Designed for Bybit traders, it integrates seamlessly with NinjaTrader, providing comprehensive asset coverage, a user-friendly interface, and more.
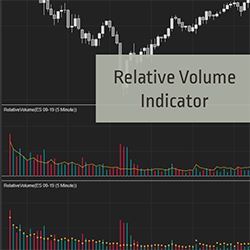
Detect unusual or below average volume easily. Identify the start or end of a move with no effort. Relative Volume (RVOL) compares current volume to the average volume for the same time of day. Start your 2-week trial now!
A modified 'Previous-Day OHLC' that includes JTFutures' most powerful level, the Holy Orange Power Level. This level prints every morning and is plotted based on overnight price action.
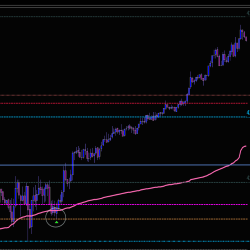
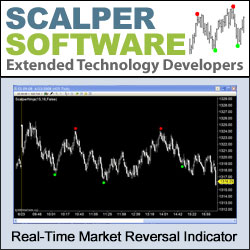
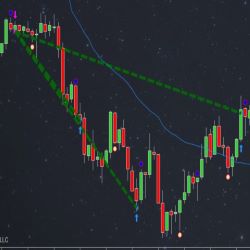
Scalper Pivot Point allows traders to identify turning points, and aids in spotting trends and reversals. It can be loaded on any data-compression type of chart. When several conditions met, a signal is plotted on the user’s chart. See samples of the Scalper Pivot Point in action on NinjaTrader!
Automated Trading Strategy for the MNQ based on user inputted times.
December 2, 2024
Mastering Sideways Markets With Auction Bars and Range Projections
November 19, 2024
Enhancing Your Automated Trading System: Key Insights from Best Pro Trade
November 14, 2024
NinjaTrader New Ecosystem Tools: October 2024 Edition
Enter Email for Updates