Next-generation support and resistance for active traders. Chartmap™ makes drawing lines on a chart a thing of the past by utilizing an innovative pattern finding algorithm to generate a heat map of powerful support and resistance. Upgrade your charts today with a 7-day free trial.
Unlock the power of Wyckoff VSA through an optimized package that uses SMART Technology to generate easy-to-use live alerts and preset approaches. Save 80% charting time with SMART Technology. Four easy-to-implement, rules-based strategies. SMART audible notifications for signals and setups.
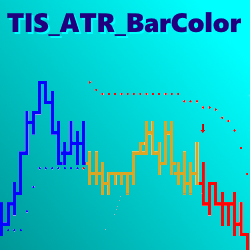
The ATR_BarColor Setup is the evolution of Supertrend; it adds a 3rd state ( Trending Up, Trending Down and Non-Trending ) that helps to avoid sideways market conditions. Bars are colored for quick condition identification.
Trade smarter with multiple candlestick patterns. This indicator uses pattern recognition to scan for 16 different candlestick patterns. It detects bullish, bearish and gap patterns. It can be used with Bloodhound and NinjaTrader's Market Analyzer.
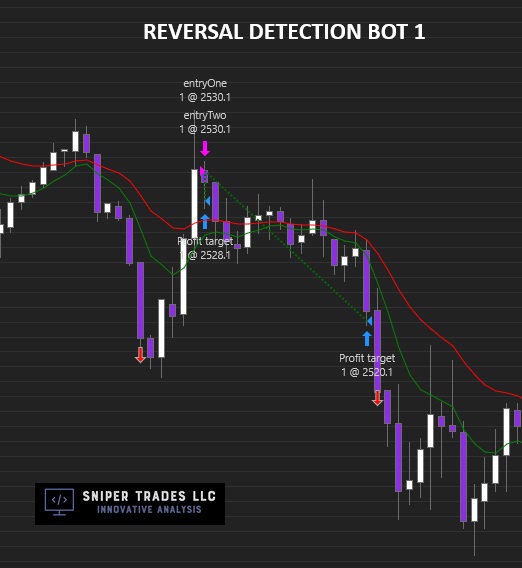
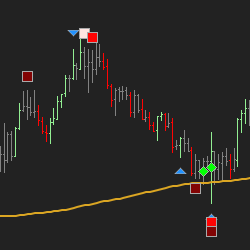
This fully customizable bot will look for a trade setup pattern, indicate the expected direction (arrow up or down), and then wait for the price action to pullback to either the 9 EMA (green line) or the 21 EMA (red line) to enter into the position.
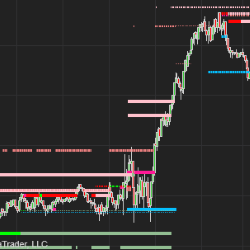
QSR Pro utilizes their advanced techniques to identify, validate, and invalidate support and resistance levels like never before. Unlike other indicators that rely solely on swing highs and lows, QSR Pro incorporates multiple factors to ensure precise support and resistance identification.
Day Trading Course with Order Flow analysis and live trading sessions.
Highly sought after day trading strategy and methods course. Featuring the successful "Ultimate 25Bar, Ultimate Backdoor, and Ultimate Slingshot" systems. Complete with over 65 videos and more. Over 13 years strong. Includes access to our Ultimate Scalper group chat and text support.
The Price Action Analyzer helps identify and alert price action events when the market enters your reversal area. This tool supports Hidden Gap Bars, Inside/Outside Bars, Up Thrust and Spring, No Demand and No Supply, Effort to Rise, Effort to Fall and Stopping Volume!
ForexAlgo is a powerful trading signal app designed for Forex traders, offering precise signals for Forex pairs. Enjoy a 3-day free trial to experience its accuracy and effectiveness. Available on both iOS and Android, ForexAlgo empowers traders with timely insights.
December 2, 2024
Mastering Sideways Markets With Auction Bars and Range Projections
November 19, 2024
Enhancing Your Automated Trading System: Key Insights from Best Pro Trade
November 14, 2024
NinjaTrader New Ecosystem Tools: October 2024 Edition
Enter Email for Updates