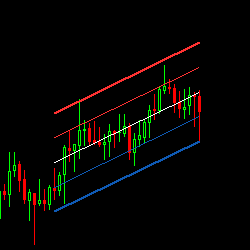
The Linear Regression Channel (LRC) trading indicator gives objective buy & sell signals based on price volatility. The upper and lower channels (linear regression lines) can be used to enter & exit the market in potential reversal zones. Add this to your chart today.
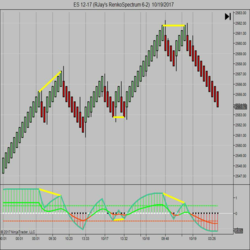
The Divergence Indicator offers combinations of single, double, and hidden divergence displays. Divergence measured is price action compared against a selectable NinjaTrader indicator. The selection list includes TRIX, RSI, CCI, RVI, MACD, TSI & more. Get a free trial now!
ATS QQE is a powerful Quantitative Qualitative Estimation (QQE) indicator with additional options which make it more versatile.
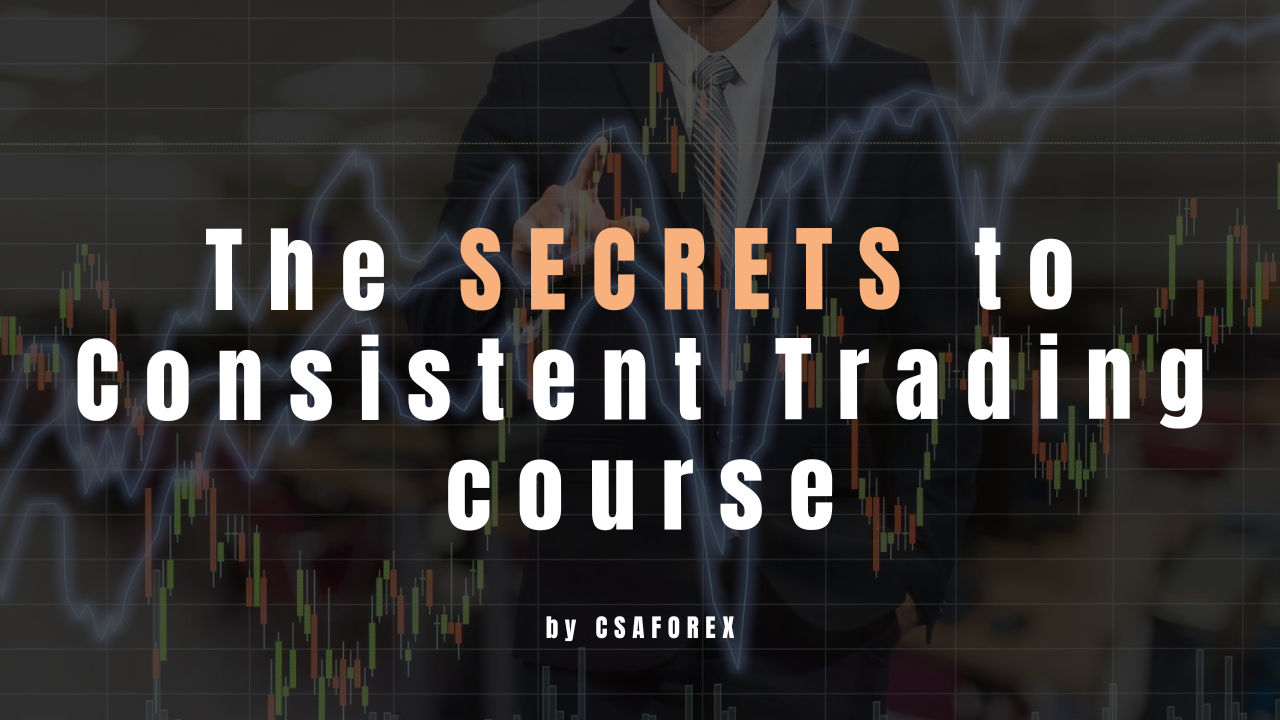
Everything you need to know about consistent trading video tutorial course. This course covers the following: How to use the Metatrader4 trading app, market Analysis (Fundamentals & Technicals), risk management, trading psychology (trading plan, journal, management, goal, etc.)
The VTP was created to provide Veterans with an introduction to financial markets. The Stage 5 Online Course educates traders on how to approach their funding challenges within the Prop Firm space. It aims to helping support traders to succeed, and build a sustainable trading business.
Thapelo FX Knight Trading Academy is a trading training academy, helping amateur to middle traders gain their consistency in the trading industry.
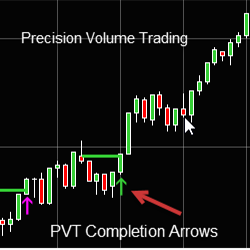
Precision Volume Trading Completions Arrows helps traders determine if the market will move up or down.
Simplify your trading process! The Elite Indicators predict major tops and bottoms, diagnose the direction and strength of price action, and calculate the best stop-loss and profit-target levels! Try a 30-day demo today!
Advanced Wyckoff Course: Learn advanced concepts of the Wyckoff Method in a simple way. This will teach you unique concepts that will make you an expert in the Wyckoff methodology and take your analysis and trading to the next level.
This model balances four separate risk lenses that seek to generate alpha while moderating standard deviation over multi-year periods. Each risk lens is independently applied based on Alpha Vee's breakthrough fundamental momentum research. Contact Alpha Vee for more information.
December 2, 2024
Mastering Sideways Markets With Auction Bars and Range Projections
November 19, 2024
Enhancing Your Automated Trading System: Key Insights from Best Pro Trade
November 14, 2024
NinjaTrader New Ecosystem Tools: October 2024 Edition
Enter Email for Updates