The Line Break Bar is one of the most effective ways to reduce chart noise. It provides accurate back-testing results by showing the correct open prices and restoring the wicks. Easily recognize divergence & price action patterns & eliminate noise from traditional minute charts. Get started today!
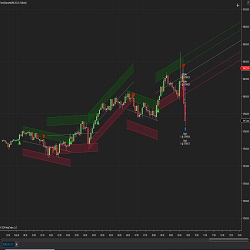
Channel levels are defined based on high and low prices influenced by candlestick bodies. These points are calculated based on the defined channel levels and look back periods. Delta values are computed to determine the channel's upward or downward slope.
Channel VA MNTrader is a fully automated trading system. Trading is based on Renko strategy using a Keltner Channels indicator. The filtration system is based on the ADXVMA & the MACD indicator. It has an improved position support system with flexible settings that will improve trading consistency.
B4 CoPilot simplifies trend direction with a visual representation in chart background colors, shows optimal trade entry points with arrows and price regions. It also has several models that execute semi-autonomous order flow entry, using our institutional grade day trading engine.
The Emet Trading Solutions team of experienced programmers specialize in converting existing indicators, strategies or code from cAlgo, MetaTrader, TradeStation & MultiCharts to NinjaTrader 7 or NinjaTrader 8. Get a free quote for your project today!
Trading requires edge, but in the new world of machine and algorithmic trading disrupting information processing and decision making, it’s incredibly elusive. Boss Trading addresses this problem by introducing professional experience and trader role modelling via live trading masterclasses.
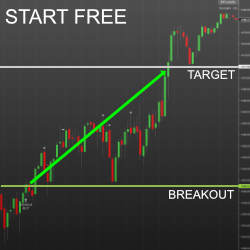
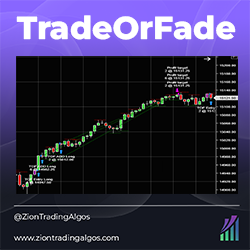
TradeOrFade is a momentum-based intraday strategy on the 5-minute chart. It determines whether or not there is an opening gap on NQ and takes advantage of statistically relevant information regarding gap ups and gap downs. It takes a starter position and pyramids into the position.
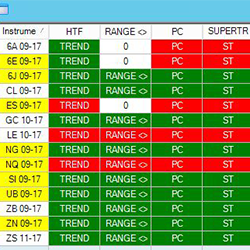
The JATS Market Analyzer Template for the NinjaTrader 8 platform has customized blackbox BloodHound solvers that show when momentum, linear regression and trend are in synchronization across multiple time frames.
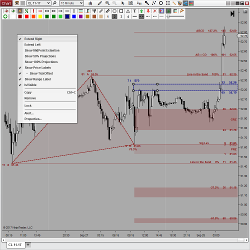
DrawBar Ultimate takes manual drawing, styling and chart analysis to the next level! It contains hundreds of options and 13 custom drawing tools including Volume Profile. All have multiple extensions, labeling, unique right click context menus, one click template switching and more.
Saving you time is really import to us which is why the XABCD Pattern Suite will scan, find and alert you to XABCD patterns in any market and any timeframe. Once found, the pattern is automatically drawn onto the chart to make things easier. This includes everything you need to learn patterns.
March 25, 2024
Trading Pullbacks and Reversals: Simplifying a Once Complex Retail Trading Strategy
March 21, 2024
VWAP Indicator: Average Price Shown Based on Price, Volume
March 18, 2024
Trade Copier Strategies: Make Efficiency Work for You When Futures Trading
Enter Email for Updates