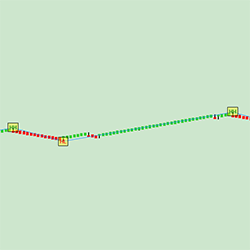
The Volatility Bands indicator attempts to present a way to measure and visualize volatility, using standard deviations (σ) and average true range indicator, and aims to point out areas that might indicate potential trading opportunities. Click to learn more.
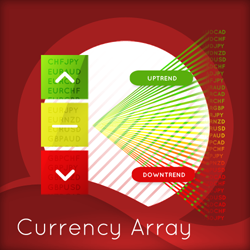
Imagine what it would be like to monitor all 28 currency pairs on one chart. To see trend strength, momentum and congestion revealed instantly and in real time. Throw out your multiple screens and grab your copy now!
Do you want to know the trading setups we use? Create your own profile FREE on our website and you’ll have access to our course videos where we explain each of our patterns. Gain the knowledge to access our EPyF Trading Room and learn our way of understanding the market.
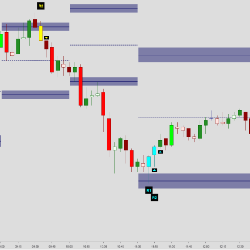
The Auction Bars indicator identifies higher time-frame ranges, displayed as Auction Ranges. These ranges show the current market value area of the ongoing auction. The accompanying congestion zones work as support / resistance where spike and reversal patterns frequently plot.
Nordman Algorithms provides indicator and strategy programming services. Indicators for trend identification, trade zone detection, news impact calculation, price pattern visualization & more can be built, as well as extendable, maintainable systems that follow your trade strategy.
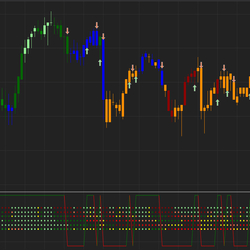
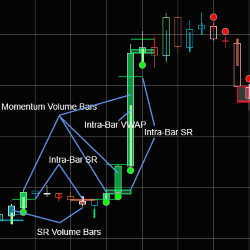
Every bar contains information. You miss a lot of valuable information due to filtering bars by time, variance or some other method. The best solution is to allow these bars to provide you with all the valuable and needed information in a compact and informative manner.
The SuperDOM Average Price Column shows a position average price accumulated since the first order execution. All opened and closed executions from the beginning of the position are used for the calculation. Save time by knowing your current position's average price for all of your past entries!
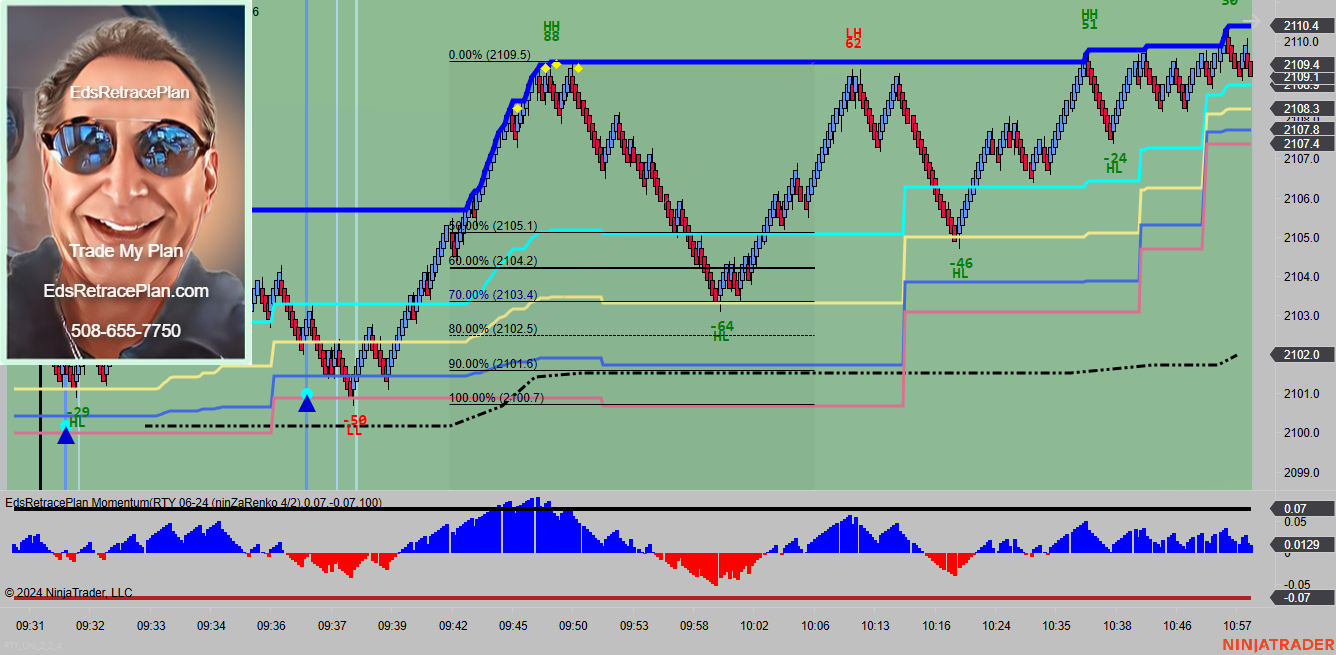
EdsRetracePlan, the innovative system that provides specific day trading signals for ES, YM, RTY, NQ, CL and GC, is now broadcasting live charts to the EdsRetracePlan YouTube channel, daily from 9:00AM to 11:00 EST. For the YouTube URL to this daily show please send an email to [email protected].
You can use this crème de la crème indicator to determine the dominant direction of price action and trend. It can be used on multiple timeframes for identifying qualities that must be present before a trade is considered.
Turn your ideas into code! We work 1-on-1 with you to understand your needs and engineer a quality software solution that meets them. Automated strategies, indicators, data analytics, portfolio supervision – let us know your needs, we’re here to make it happen. Get in touch with us today!
December 2, 2024
Mastering Sideways Markets With Auction Bars and Range Projections
November 19, 2024
Enhancing Your Automated Trading System: Key Insights from Best Pro Trade
November 14, 2024
NinjaTrader New Ecosystem Tools: October 2024 Edition
Enter Email for Updates