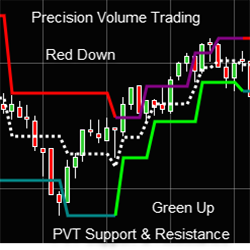
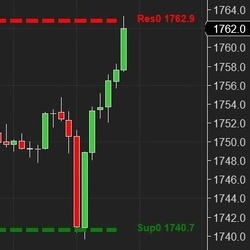
Precision Volume Trading Support & Resistance measures each swing point for traders to know where buyers and sellers are.
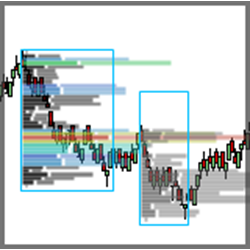
LogikVolumeWand is a dynamic volume / tick / price distribution analysis tool that displays information computed within a user drawn rectangle, combining the usefulness of Volume Point of Control, Volume Delta, and Volume Footprint analysis into one tool. See more in the video demonstration!
Trading coach with volume and price indicators.
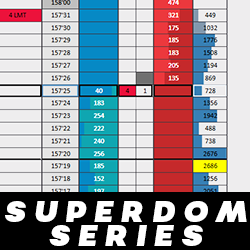
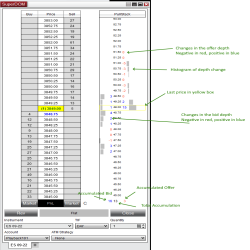
6 highly customizable and powerful columns (plus the SuperDOM utilities) are available for the NinjaTrader SuperDOM. Create the ultimate SuperDOM - now with trading capabilities, unprecedented performance, and all the features you expect from a professional set of DOM columns!
The MCumulativeDelta Indicator shows the bid / ask volume displayed in a histogram over a period. It serves to determine whether supply or demand is dominating and in control and the buying / selling pressure.
The Pull Stack Super DOM column shows you changes in the order book. There are several modes to this indicator to help give you a nuanced view and find the state of the market at each price level.
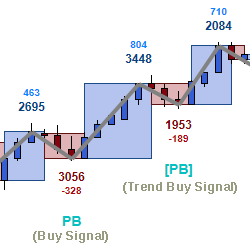
Q-Scalper indicator identifies the confluence dynamics between Support and Resistance levels with significant Trendlines, providing very significant trade levels. These levels produce very actionable and valuable trade set-ups. Click the link to explore this great indicator.
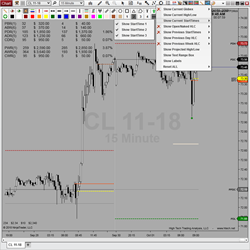
Price Times Plus plots 24 current, previous & projected OHLCR levels of significance! It features both daily & weekly levels, projected ranges, 3 user defined start times, unique summary information, a toolbar icon for easy configuration, and is Market Analyzer, Strategy Builder & Bloodhound ready!
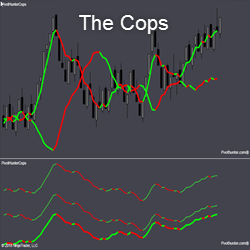
THE COPS includes the duo, Dog and Sheriff, working in close harmony. Dog swings wide when The Convict begins to run. When Dog is narrow, traders wait for the separation before considering a market entry. The COPS in the bottom panel measure momentum at 3 levels.
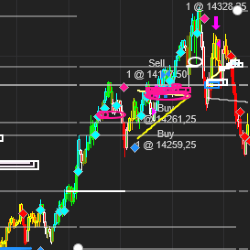
Based on an Artificial Intelligence (AI) engine, the E.G. Trigger Point calculates support and resistance (S&R) lines. The S&R are specific price points on a chart expected to attract the maximum amount of either buying or selling.
December 2, 2024
Mastering Sideways Markets With Auction Bars and Range Projections
November 19, 2024
Enhancing Your Automated Trading System: Key Insights from Best Pro Trade
November 14, 2024
NinjaTrader New Ecosystem Tools: October 2024 Edition
Enter Email for Updates