B4 CoPilot simplifies trend direction with a visual representation in chart background colors, shows optimal trade entry points with arrows and price regions. It also has several models that execute semi-autonomous order flow entry, using our institutional grade day trading engine.
When MFI, RSI, and Stochastic converge, the background is colored, signifying the overlapping zone and triggering immediate alerts via chart markers. This visually appealing and efficient tool excels beyond conventional oscillator applications, optimizing chart space for essential information.
CB ZoneChart V5.0 update was just released. It now comes with turning bars included to help gage the tops and bottoms or turns in the market. Also includes the opening ranges, zigzag support and resistance, golden zone Fibs, and the most requested blue dotted lines support and resistance.
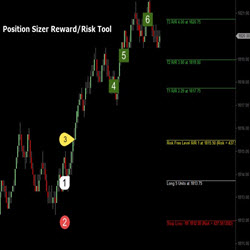
This tool auto-calculates position size based upon account value and percentage risk parameters input by trader. Displays the Entry Price, Stop Loss, and up to Three (3) Price Targets based on R-values. If you a serious trader, then this is an essential addition to your trader toolbox.
ET 8 includes all the features of ET 7 plus the ability to plot trade history. Determine the strength of prior market highs and lows by understanding if they were set from large or small trades to confirm whether large traders are participating in the current market action. Free 2 week trial.
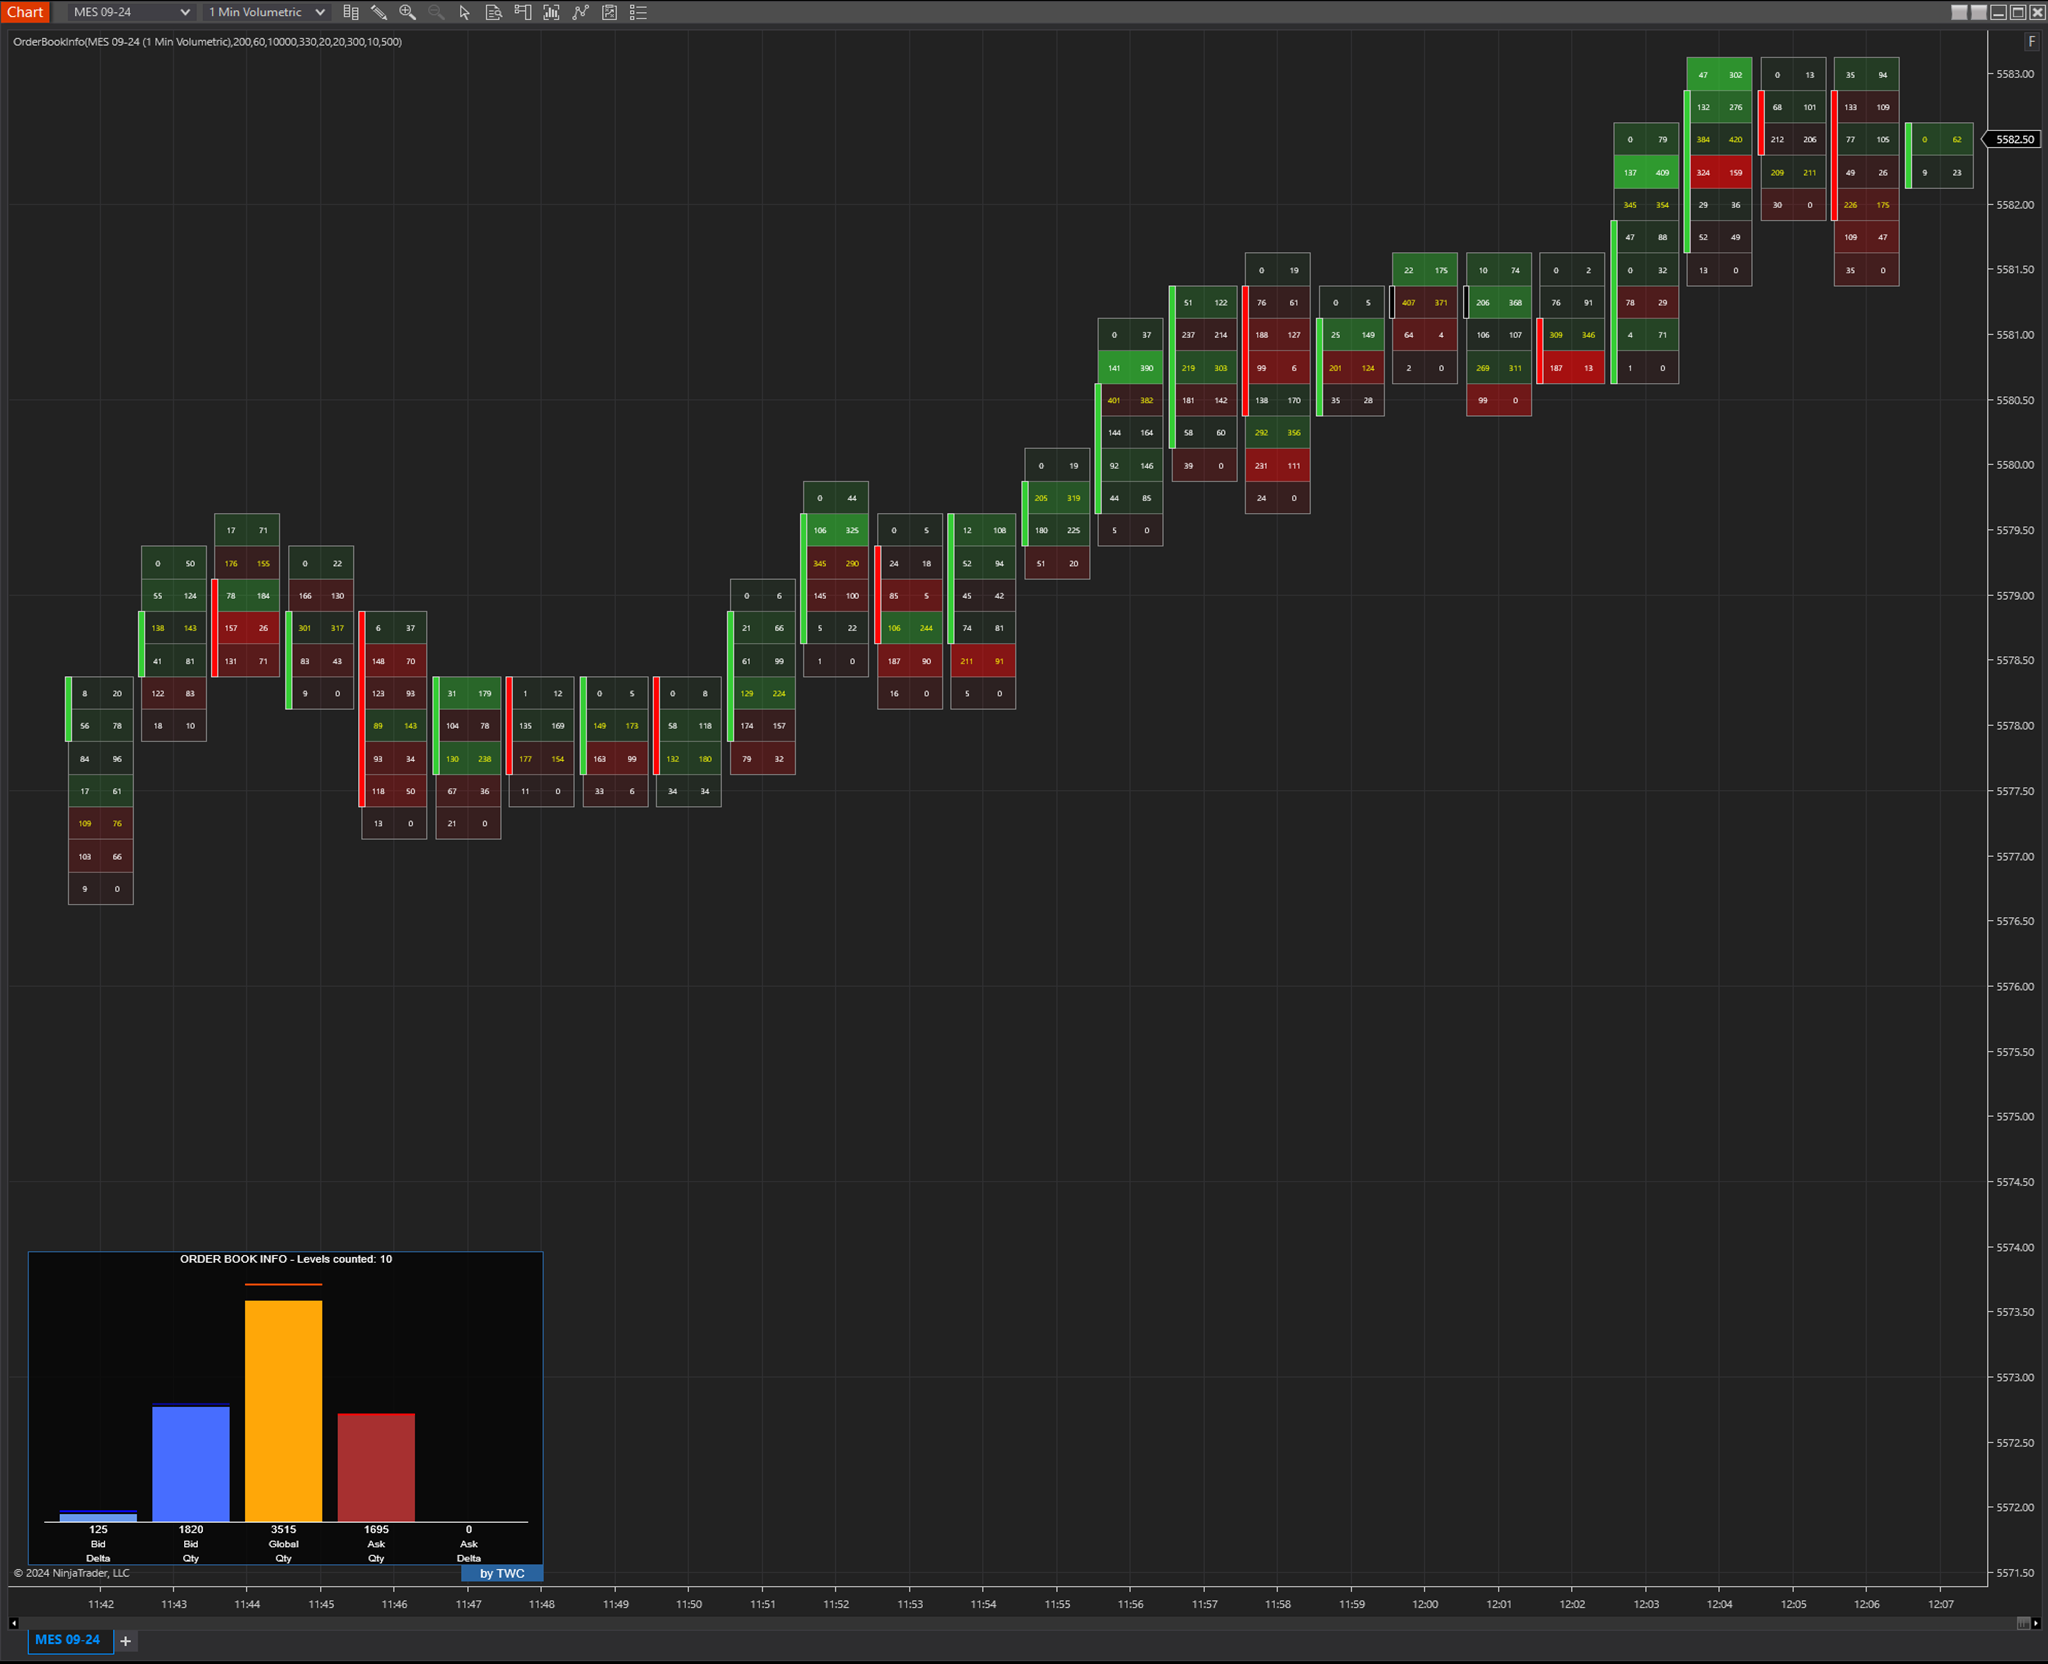
TWC Order Book Info graphically displays the number of orders in a Depth of Market (DOM). This widget shows the total number of orders, buy orders, sell orders, and the delta between them.
If you seek a trend-following system capable of minimizing failed entry signals in choppy markets, your search ends with RK-System Platinum v4. This system provides up to 4 signal types, with the price action signal type proving to be particularly reliable and productive in our backtesting.
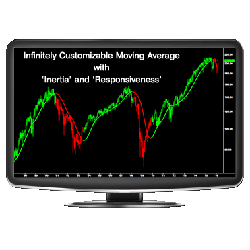
The ZMA™ is the most adaptable and customizable moving average indicator to date. By using an algorithm that incorporates the concepts of inertia, energy, and responsiveness, the ZMA is infinitely flexible and significantly more effective than other moving averages available.
Master the market with this intelligent trailing indicator! Smart volume-based trailing algorithm identifies up and down trends. Perfectly suited to support “stop-and-reverse” as well as “always-in-the-market” trading styles. Discover the most consistent symbols with an instant performance graph!
Chompsky Fibs with Measured Moves: Auto plots the 61.8% zone and 38% zone with color changing for bias. Customizable Tags and signals for custom adoption from bots such as Trade Saber's Predator.
December 2, 2024
Mastering Sideways Markets With Auction Bars and Range Projections
November 19, 2024
Enhancing Your Automated Trading System: Key Insights from Best Pro Trade
November 14, 2024
NinjaTrader New Ecosystem Tools: October 2024 Edition
Enter Email for Updates