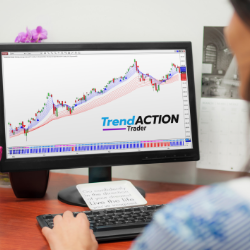
Trend Action Trader keeps you on the right side of the market with clear high probability signals for all markets and timeframes. Its price patterns and momentum algorithm are ideal whether you trade short or long term. Improve your trading consistency - try risk-free for 30-days!
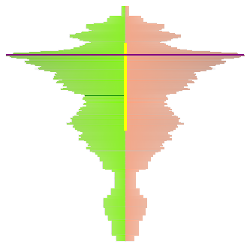
Volume has gravity, and the market has a memory. See each bar's volume profile simply and clearly with the TC_BarProfiler. Look inside the bar to see where the action happened, and detect the important price levels. Free to download for NinjaTrader 7 & NinjaTrader 8!
Join this Futures Trading Discord! Learn to trade futures, ace prop evaluations, utilize automated strategies, and engage in live trading. Aspiring traders face challenges in meeting evaluation criteria, and they're here to help you not only pass but excel in these assessments.
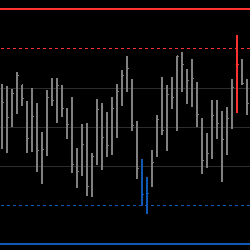
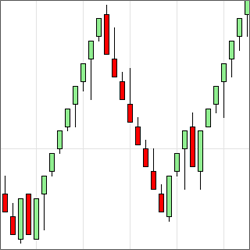
The Value Chart Indicator draws bars over a dynamically created scale from the last highest to the lowest values over a period. It attempts to spot market oversold and overbought areas on a short time scale, when price is most probable to revert to its mean.
Toni Hansen’s most popular online trading course is now available as a boot camp! Originally developed by Toni in the late 90s, her straightforward trading methodology has withstood the test of time.
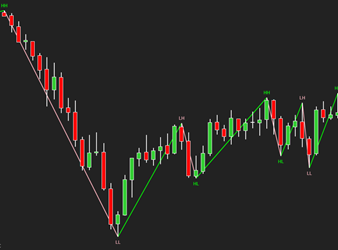
The ZigZag indicator is primarily used to identify significant highs and lows in the price chart, which helps traders filter out market noise and focus on important price movements.
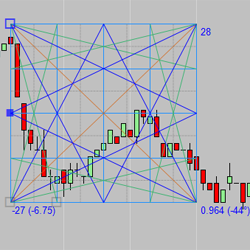
The IT_GannBox tool is fully loaded for chart analysis price prediction. This tool has all types of visual features and three modes of operation. Industry standard Fixed Ratio and FreeForm modes plus the custom FreeForm Ratio mode. Adding the IT_ChartSquare tool will allow visually accurate angles.
The Lucrum Vision Renko Bar reflects the actual price of the underlying instrument so you can be confident in its ability to accurately represent true price. Get accurate Renko charting for both live and backtested trading environments.
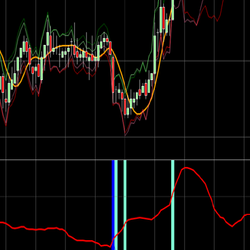
This indicator is extremely versatile and can be used in several time frame charts and even bar charts including range, tick or volume. It works best for instruments like NQ, ES or YM over tick charts. See the real price movement and identify the spikes in the curve plot.
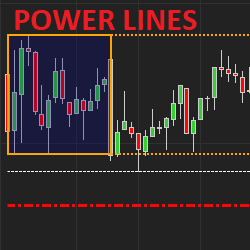
The itcPowerLines indicator displays important intraday support/resistance levels for stock traders (Opening range, morning H/L, yesterday H/L, Weekly H/L, daily SMA/EMA). Colors, styles & width are customizable. Users can also define which elements to display including levels for past days.
December 2, 2024
Mastering Sideways Markets With Auction Bars and Range Projections
November 19, 2024
Enhancing Your Automated Trading System: Key Insights from Best Pro Trade
November 14, 2024
NinjaTrader New Ecosystem Tools: October 2024 Edition
Enter Email for Updates