Share Service in NinjaTrader 8 is a secure file sharing platform specifically designed for the NinjaTrader 8 trading platform.
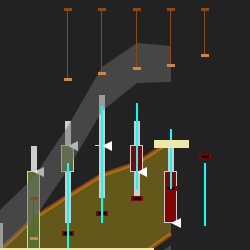
Drummond Geometry unlocks the power of your NinjaTrader platform by revealing the market's hidden structure to you. Drummond Geometry combines short-term moving averages and accurate support/resistance lines, all coordinated on multiple time periods. Trade with confidence!
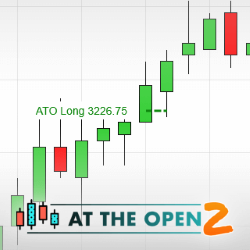
Use the ATO 2 indicator and learn how to take advantage of big price action moves right after the market opens. This is our flagship day trading method which we have improved over the years. Come see what put us on the map. Package includes both video and live training.
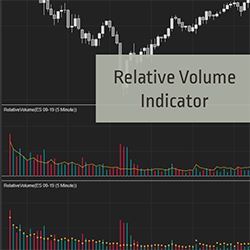
Detect unusual or below average volume easily. Identify the start or end of a move with no effort. Relative Volume (RVOL) compares current volume to the average volume for the same time of day. Start your 2-week trial now!
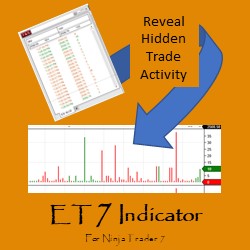
Elephant Tracks Software’s ET 7 allows traders to select just the trade sizes they want to see, revealing hidden patterns. This advanced Time & Sales information can be highly beneficial for individual traders to understand institutional trading behavior. Get started with a 2-week free trial!
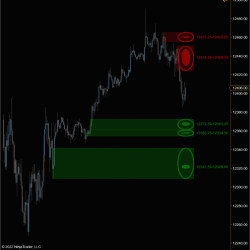
Patented! 'UFOs' stands for UnFilled Orders. Intelligent technology saves time and adds precision when planning entries and exits. Identify buy and sell UnFilled Orders in all markets and timeframes. Answers the question, “What is potentially an intelligent buying price or selling price?”
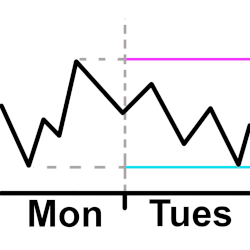
Plot a horizontal line for the high and low from the previous intraday. The user configures the open and close time they want to use for the intraday hours. This means the user can plot the high and low starting 30 minutes before the actual open and after the actual close if they want to.
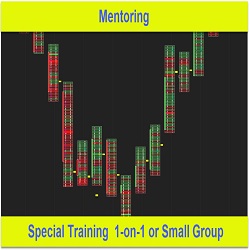
If you’re struggling with specific issues such as your entry or even your exit or developing a strategy that works for you, the first port of call is a free 15-minute consultation where we can discuss your needs and formulate a 1-on-1 mentoring plan. Reach out no matter what your trading issue is!
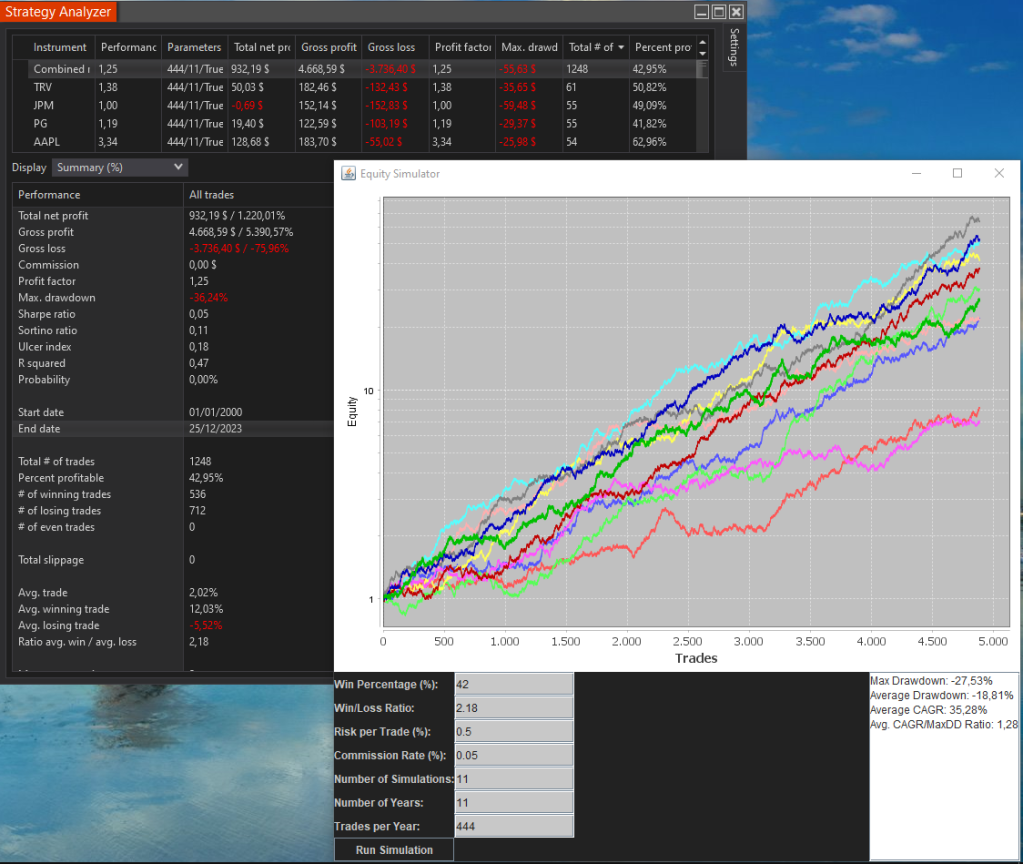
We can take the parameters from the Strategy Analyzer summary and generate a forecast for the desired numbers of trades and years. We can estimate our optimal risk per trade.
Build a foundation for technical and fundamental analysis. Prioritize tools, learn proprietary calculation and information management through strategies universal in application. Includes Daily Briefing, Evening Chartbook & Market Recap, plus Sunday Evening Review. ES, Oil, Gold 10 yr. Note, NQ.
December 2, 2024
Mastering Sideways Markets With Auction Bars and Range Projections
November 19, 2024
Enhancing Your Automated Trading System: Key Insights from Best Pro Trade
November 14, 2024
NinjaTrader New Ecosystem Tools: October 2024 Edition
Enter Email for Updates