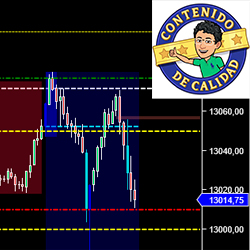
Análisis de mercados americanos una hora antes de la apertura: Futuros de Nasdaq (NQ y MNQ), S&P (ES y MES), Dow Jones (YM y MYM), Russell (RTY y M2K), Petróleo (CL y MCL) y Oro (GC y MGC). Determinación de niveles de compra y venta con Price Action y Smart Money.
The TrendLord indicator is a chart overlay indicator that can be used as a confirmation indicator. It is a derivative of a smoothed moving average but with the advantage of representing it as a colored change histogram. Click to learn more.
The Session Delta Pivot monitors the aggressive auction participants within a given session. By mapping this type of activity, the user can gauge the potential location for initiative activity as well as develop an understanding of directional day types.
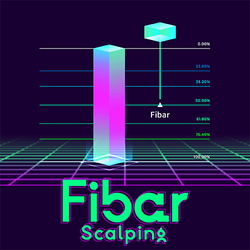
The indicator produces a Fibar signal based on three criteria: a reversal bar, retracement, and subsequent price return. Specifically designed for the KingRenko$ bar, it stands as an indispensable tool for making precise scalping decisions.
See trade setups develop in real time in the Easy E-mini Trade Chat Room! Open Monday – Thursday 9:15 – 12:00 ET, sign up for your 3-day trial today!
ElliottWaveTrader offers a live Trading Room of market analysis, based on Elliott Wave principle. Founded in 2011, the site benefits traders looking to anticipate the direction of U.S. & world equity indices, stocks, bonds, metals, energy & more over a time horizon of several days to several months.
If you’re struggling with specific issues such as your entry or even your exit or developing a strategy that works for you, the first port of call is a free 15-minute consultation where we can discuss your needs and formulate a 1-on-1 mentoring plan. Reach out no matter what your trading issue is!
Custom Development Services are tailored for NinjaTrader users, offering bespoke solutions across markets. They provide real-time cryptocurrency data integration, custom indicators, strategies, and add-ons to optimize trading performance and profitability.
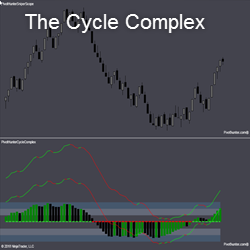
THE CYCLE COMPLEX measures price momentum at 4 levels: the histogram, 2 lines of higher sensitivity, and a dotted bull bear line. When the histogram is in the bands and turns, the pivot is often stronger. If the histogram is above or below the bands, the strength is even greater.
Get information about the development of a dynamic and descretionary trading model. This is intended to inform people of a coaching program tailored to their specific needs in order to make them more consistent traders.
December 2, 2024
Mastering Sideways Markets With Auction Bars and Range Projections
November 19, 2024
Enhancing Your Automated Trading System: Key Insights from Best Pro Trade
November 14, 2024
NinjaTrader New Ecosystem Tools: October 2024 Edition
Enter Email for Updates