Would you like to see traders' emotions visualized right on a chart? Identify developing intraday reversals in real time, detect where retail traders place their stops and trade against them. Check historical data for solid setups. Get started with your 7-day free trial today!
Use the Trade Scalper to pinpoint the exact moment you should place a scalping trade. What is scalping? Fast, in & out trading - multiple times per day. Included are both video and live training.
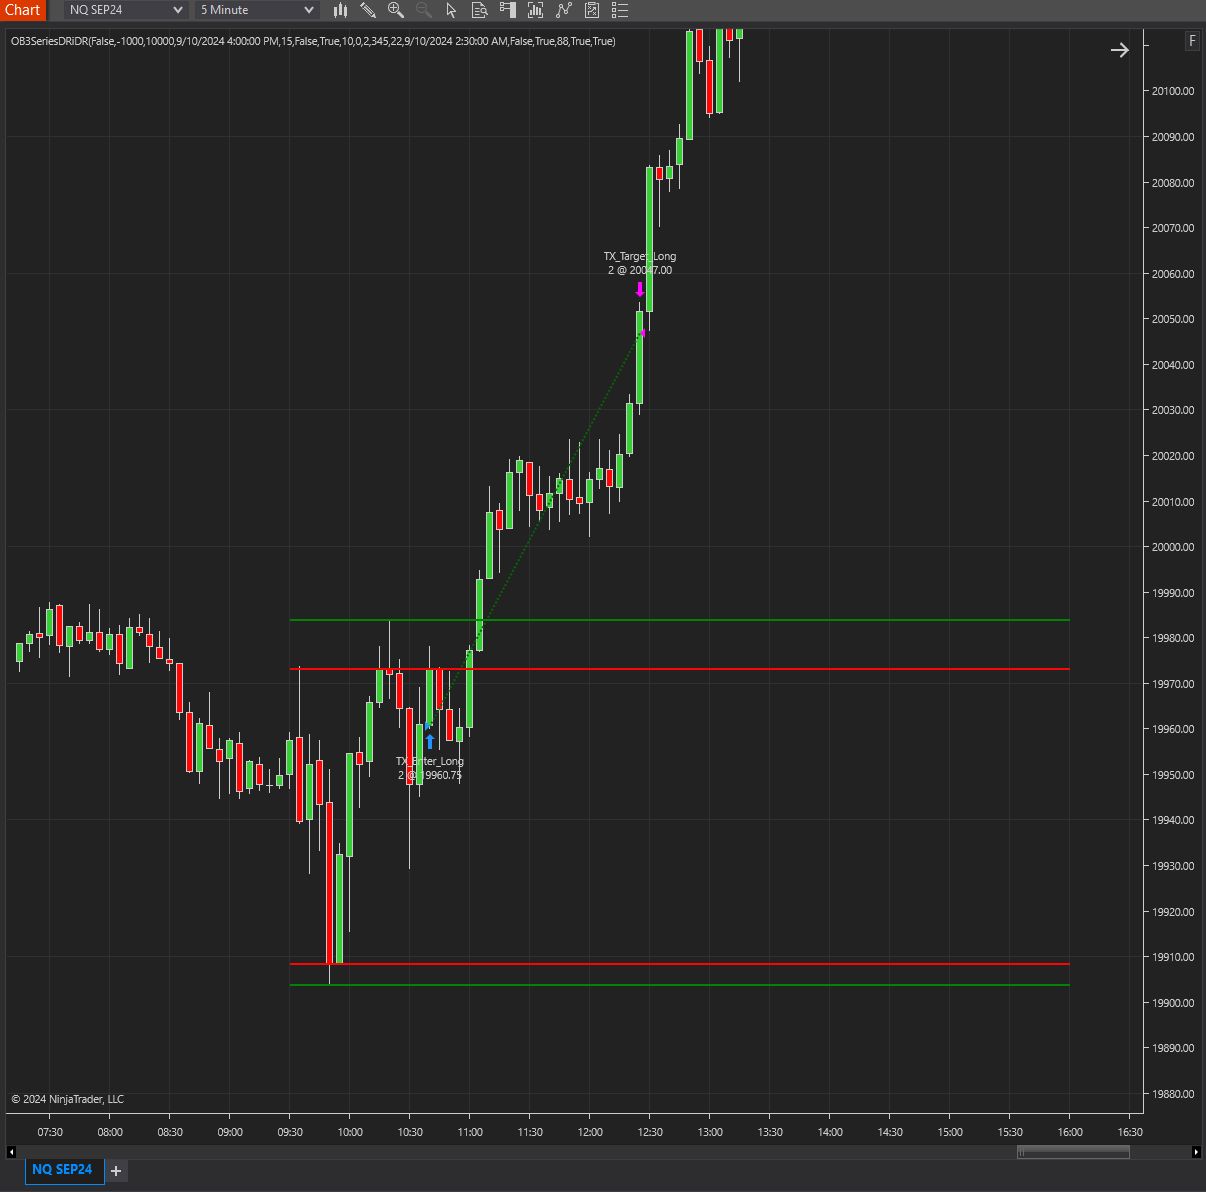
The DR/iDR strategy works by calculating the high, low, and close prices during the critical first hour of trading (9:30–10:30 AM) to determine the Daily Range. It then generates Implied Daily Range levels based on this data, providing clear markers for potential breakout or reversal zones.
Track NYSE and NASDAQ market breadth divergence directly from your price chart - even on Renko bars! Optimal Breadth seamlessly integrates advance-decline internals with your price chart and plots three intraday divergence types: classic, hidden and micro. Never miss a signal again!
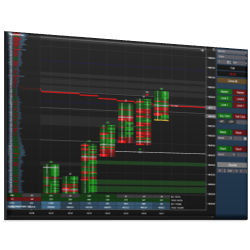
Easily build order flow strategies using bar point of control and value areas highs and lows. No complex coding required. Optimal Value Area is fully compatible with Strategy Builder.
This is an intensive one-week course that by the end of the week will have you making confident trading decisions on various asset classes. If you have an inner trader we will find it. This course also includes a free trading challenge to qualify for a funded trading account.
This ES S&P Day trading course uses Fibonacci technical analysis to identify entry and exit strategies. Rose has backtested for many years to determine the optimal Fibonacci Retracement and Extension levels for a consistent system. Get started with a free consultation with Rose!
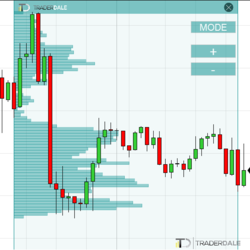
TD’s Flexible Volume Profile helps to reveal institutional trading activity and identifies the strongest support and resistance zones. The use of tick volume data makes it extremely precise, pointing to potential entries. It is easy to learn and simple to use.
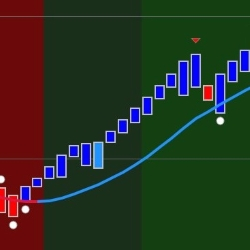
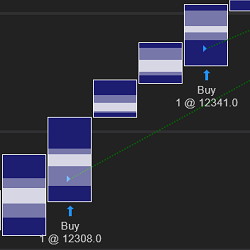
This indicator plots signals, targets, and stops based on support and resistance from various moving average types. The trend is established based on a minimum number of bars above or below the moving average. The signal is initiated on the first touch of the moving average.
KaseX is a symbol based technical analysis trading study with a simple, uncluttered display. KaseX captures dozens of complex technical signals in multiple time-frames. Variable optimization is unnecessary as pre-configured sensitivity settings are built in. Take a free 30-day trial today!
December 2, 2024
Mastering Sideways Markets With Auction Bars and Range Projections
November 19, 2024
Enhancing Your Automated Trading System: Key Insights from Best Pro Trade
November 14, 2024
NinjaTrader New Ecosystem Tools: October 2024 Edition
Enter Email for Updates