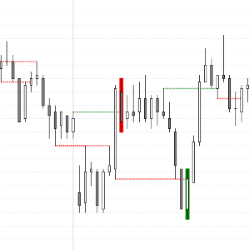
If you can see when price and momentum have diverged, then you can evaluate when and where price may change directions. The SuperD indicator tracks seven different momentum oscillators. You don't even need to have any of the momentum indicators on your chart!
This course is designed to get you up and running with strategy design and coding for NinjaTrader 8. It provides the most efficient framework that you can adapt for the architecture of most systems and demonstrates various ways to enter and exit the market using the most standard techniques.
E-Mini Tutor offers three 1 on 1 Day Trading Education options aimed at traders who are interested in understanding the markets. The Pivot based trading methodologies strive to forecast market moves before they occur empowering traders to work smart, not hard. Enroll today!
The Zerolag HATEMA is based on a TEMA that uses Heikin-Ashi candles as input series. This indicator does not depend on the selected input series, as it uses open, high, low and close of each candle.
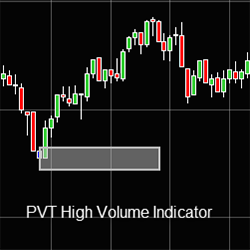
Precision Volume Trading High Volume Indicator lets you know where the volume is being traded to trade with high liquidity.
This custom BloodHound template is setup for the UniRenko Bar and waits to trigger signals as the market pulls back into the moving averages. The JATS X-RE-X Blackbox BloodHound Template allows you to execute at the specific EMA entry locations after pullbacks.
This indicator shows Breakout Tests or Breakout Pullbacks of broken support and resistance in real-time. As a beta feature you can also test Failed Breakouts. Use the Breakout Test indicator as a discretionary indicator in your day trading. Get started with a free 2-week trial today!
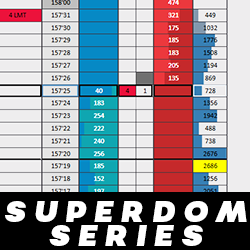
6 highly customizable and powerful columns (plus the SuperDOM utilities) are available for the NinjaTrader SuperDOM. Create the ultimate SuperDOM - now with trading capabilities, unprecedented performance, and all the features you expect from a professional set of DOM columns!
TS Custom Analysis is precise support and resistance based custom technical analysis in the style of TS TradePlan. Analysis can be done for markets specified by clients. Email TraderSmarts today for a free quote.
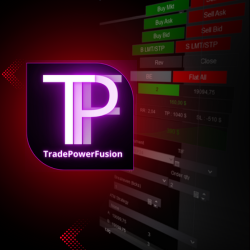
TradePowerFusion is the must-have add-on for all traders using NinjaTrader. This powerful utility allows you to copy your trading accounts & prop firm accounts with all the advanced features of the competition, while offering innovative risk management tools. Experience a different trading approach.
December 2, 2024
Mastering Sideways Markets With Auction Bars and Range Projections
November 19, 2024
Enhancing Your Automated Trading System: Key Insights from Best Pro Trade
November 14, 2024
NinjaTrader New Ecosystem Tools: October 2024 Edition
Enter Email for Updates