TS TradePlan is a precise support and resistance based trading plan, available for ES, YM, NQ, 6E, CL, and GC futures markets. Trade Plans are produced daily. Get started with a 2-week trial today.
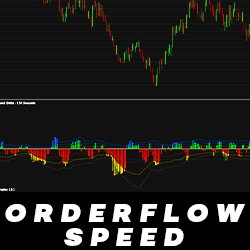
Deceptively simple, Orderflow Speed allows you to monitor market speed and enables you to view trading activity directly from your chart. It supports the Tick Replay feature so that you can visualize historical trading activity.
Intelligent technology assesses the market environment from a statistical point of view in order to answer the key questions before a trade: “Which side of the market should I be in?”, “Should I be a buyer or a seller?”, or “Should I simply avoid trading and not trade at all?”
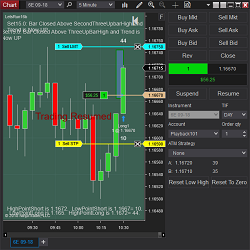
Let’s Run is a breakout strategy used for discretionary or automated trading with a Chart Trader switch. It triggers based on built-in trend finding indicators with customizable settings for stop options and reset buttons. It is fully flexible with both swing and scalp capabilities. Learn more!
Our Custom Programming service is ideal for small and short-term projects. We believe programmers should be allies to trading, not a money drain. We only accept payment if you are satisfied with our work. We charge a very reasonable $15 USD per hour rate.
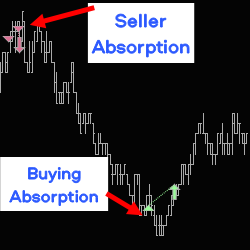
Absorptions are announced in real time with audible alerts and/or drawings on the chart. It also analyses backticking following absorptions. Adapt your trading zone live, with a toolbar on the chart. Strategy builder compatible.
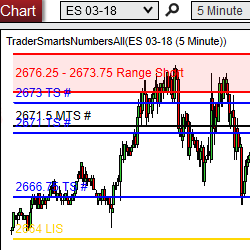
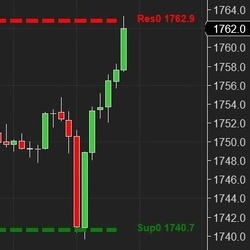
Based on an Artificial Intelligence (AI) engine, the E.G. Trigger Point calculates support and resistance (S&R) lines. The S&R are specific price points on a chart expected to attract the maximum amount of either buying or selling.
Enhanced Decision-Making; Trading Awareness/Behavior. Basic Training accelerates improvement by strengthening behaviors causing the brain to filter, process, and apply information most effectively. Psychology, sociology and neuroscience are integrated to keep decisions ahead of price movement.
Nova Wynd RK is a renko-optimized version of the Nova Wynd indicator. We eliminate the High & Low prices and only focus on the Close price in the calculation of the reference price. ninZaATR is also replaced by Tick as the unit of offset.
PriceIsKing.com's Futures RAM Indicator is based on a powerful moving average pattern recognition algorithm developed with years of research and testing. Get started with a free 2-week trial today!
December 2, 2024
Mastering Sideways Markets With Auction Bars and Range Projections
November 19, 2024
Enhancing Your Automated Trading System: Key Insights from Best Pro Trade
November 14, 2024
NinjaTrader New Ecosystem Tools: October 2024 Edition
Enter Email for Updates