An automated strategy scalping method that searches for entry conditions at the extreme areas of the market. As price approaches the everchanging highs & lows during the trading session, the ABL will look for the various internal market requirements that it considers applicable for market entries.
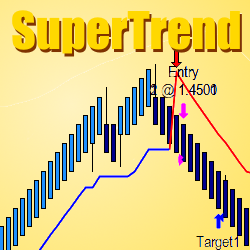
The TIS_Supertrend Indicator is a tool designed to trade volatile markets. The indicator produces 2 types of signals, a trend change arrow each time a trend line is broken and a pullback entry subsequent to the trend change. Download the TIS_SuperTrend today!
The Median Convergence Divergence (MCD) is a derivative of the Moving Average Convergence Divergence (MACD). The difference is the change in the use of the measure of central tendency. In MACD, moving average (mean) is used, whereas, in MCD, the median is used instead. Click to learn more.
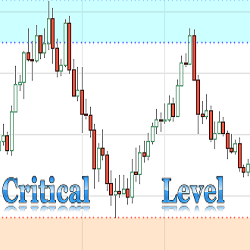
The purpose of this indicator is to automatically plot critical support and resistance levels on a chart. The Critical Support & Resistance Level Indicator comes with customizable alerts and can be added as a Market Analyzer column.
Momentum indicators work best when indicating an overbought or oversold condition within a trend. Expect a reversal back in the direction of the trend when IAMomentum reaches an extreme level while IATrend is alerting followers of that trend. Together, these two indicators highlight price reversals.
Trading OrderFlow delivers your ideas: your imagined automated strategy, semi-automated strategy or custom indicator. Turn your concept into an elegant solution adapted to your trading style and needs. Contact them about your development project for specialized service and expertise!
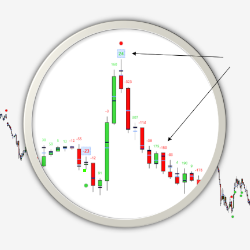
Identify the important buyer and seller zones in each candle by combining the processing of footprint information and a candle chart. Focus on your entries and exits. Get started today with a free 2-week trial!
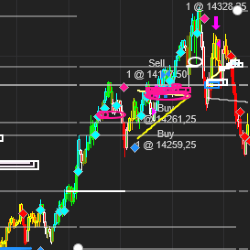
Q-Scalper indicator identifies the confluence dynamics between Support and Resistance levels with significant Trendlines, providing very significant trade levels. These levels produce very actionable and valuable trade set-ups. Click the link to explore this great indicator.
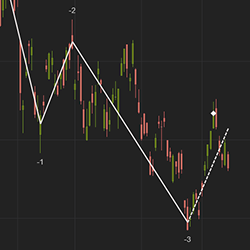
The Wave indicator is similar to an Elliot Wave with an added capability to forecast a possible market reversal. It has convenient features including the ability to number waves to help identify trend direction.
Traders formation, trading strategies and deployment using the NinjaTrader platform, trading plan, journal and back testing. From finding a hedge, to money and risk management and trading strategy deployment.
December 2, 2024
Mastering Sideways Markets With Auction Bars and Range Projections
November 19, 2024
Enhancing Your Automated Trading System: Key Insights from Best Pro Trade
November 14, 2024
NinjaTrader New Ecosystem Tools: October 2024 Edition
Enter Email for Updates