This masterclass on day trading the E-mini Futures is a two hour, in-depth, start to finish walkthrough of the Fib Retracement day trading strategy that EminiMind has used on the E-mini S&P for nearly 15 years. It can also be used on the micros and Forex.
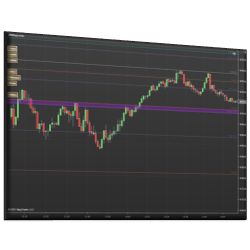
The Key Levels Confluence Indicator calculates various daily levels and combines them into powerful zones where price action is likely to respond in the future. Daily levels include the Open, High, Low and Close (OHLC) of past days, Fibonacci Levels, Whole Numbers, Current Day Levels and Pivots.
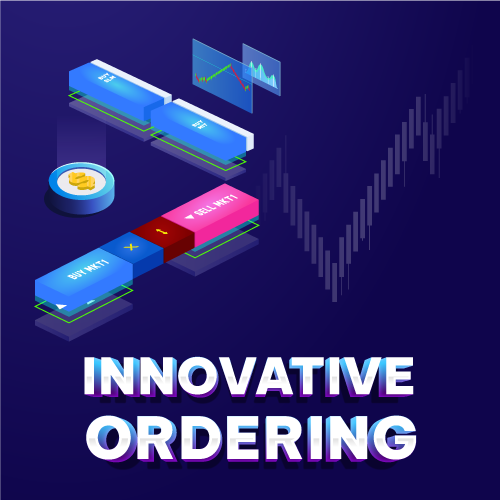
Ideal for those wanting to place pending orders with a single click, execute lightning-fast market orders, or simplify trading for users with slower computers or impaired eyesight. Key features include support for various order types, quantity presets, ATM selector, and real-time status display.
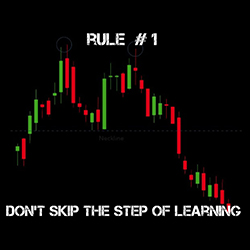
Gain an understanding of trading: market analysis, technical analysis, fundamental analysis, indicator trading, day trading/scalping, strategies, trading psychology, expectation and mindset, money management and risk management. Practice on a demo account. Referring trading brokerage/platform.
This is an introductory class that is perfect for beginners. It covers a multitude of topics including Technical Analysis and trading with custom indicators. Learn through one-on-one and group live zoom classes daily.
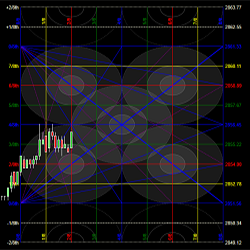
Samri Math RY Intraday is a purely PRICE-based indicator for traders who use Murrey Math methodologies. It works not just with time-based charts (day/minute/second), but also with other chart types such as Renko, Range, Volume and Tick. Multiple algorithms for calculating price levels are included.
Volume Profile is a very well-known and very much-used indicator in trading, but with a twist! Our indicator will give you the ability to automatically anchor it to various starting points and, better yet, use it in your automated strategies and backtesting.
Quality: ✅ Created by Johnny, a developer and trader for his own trading. ✅ More than ten powerful signals clearly codified and documented. ✅ Automatic creation of algorithmic zones. ✅ Use possible even without knowing the footprint. ✅ No risk of the graph freezing due to the tickreplay mode.
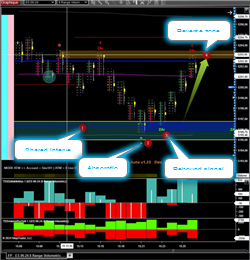
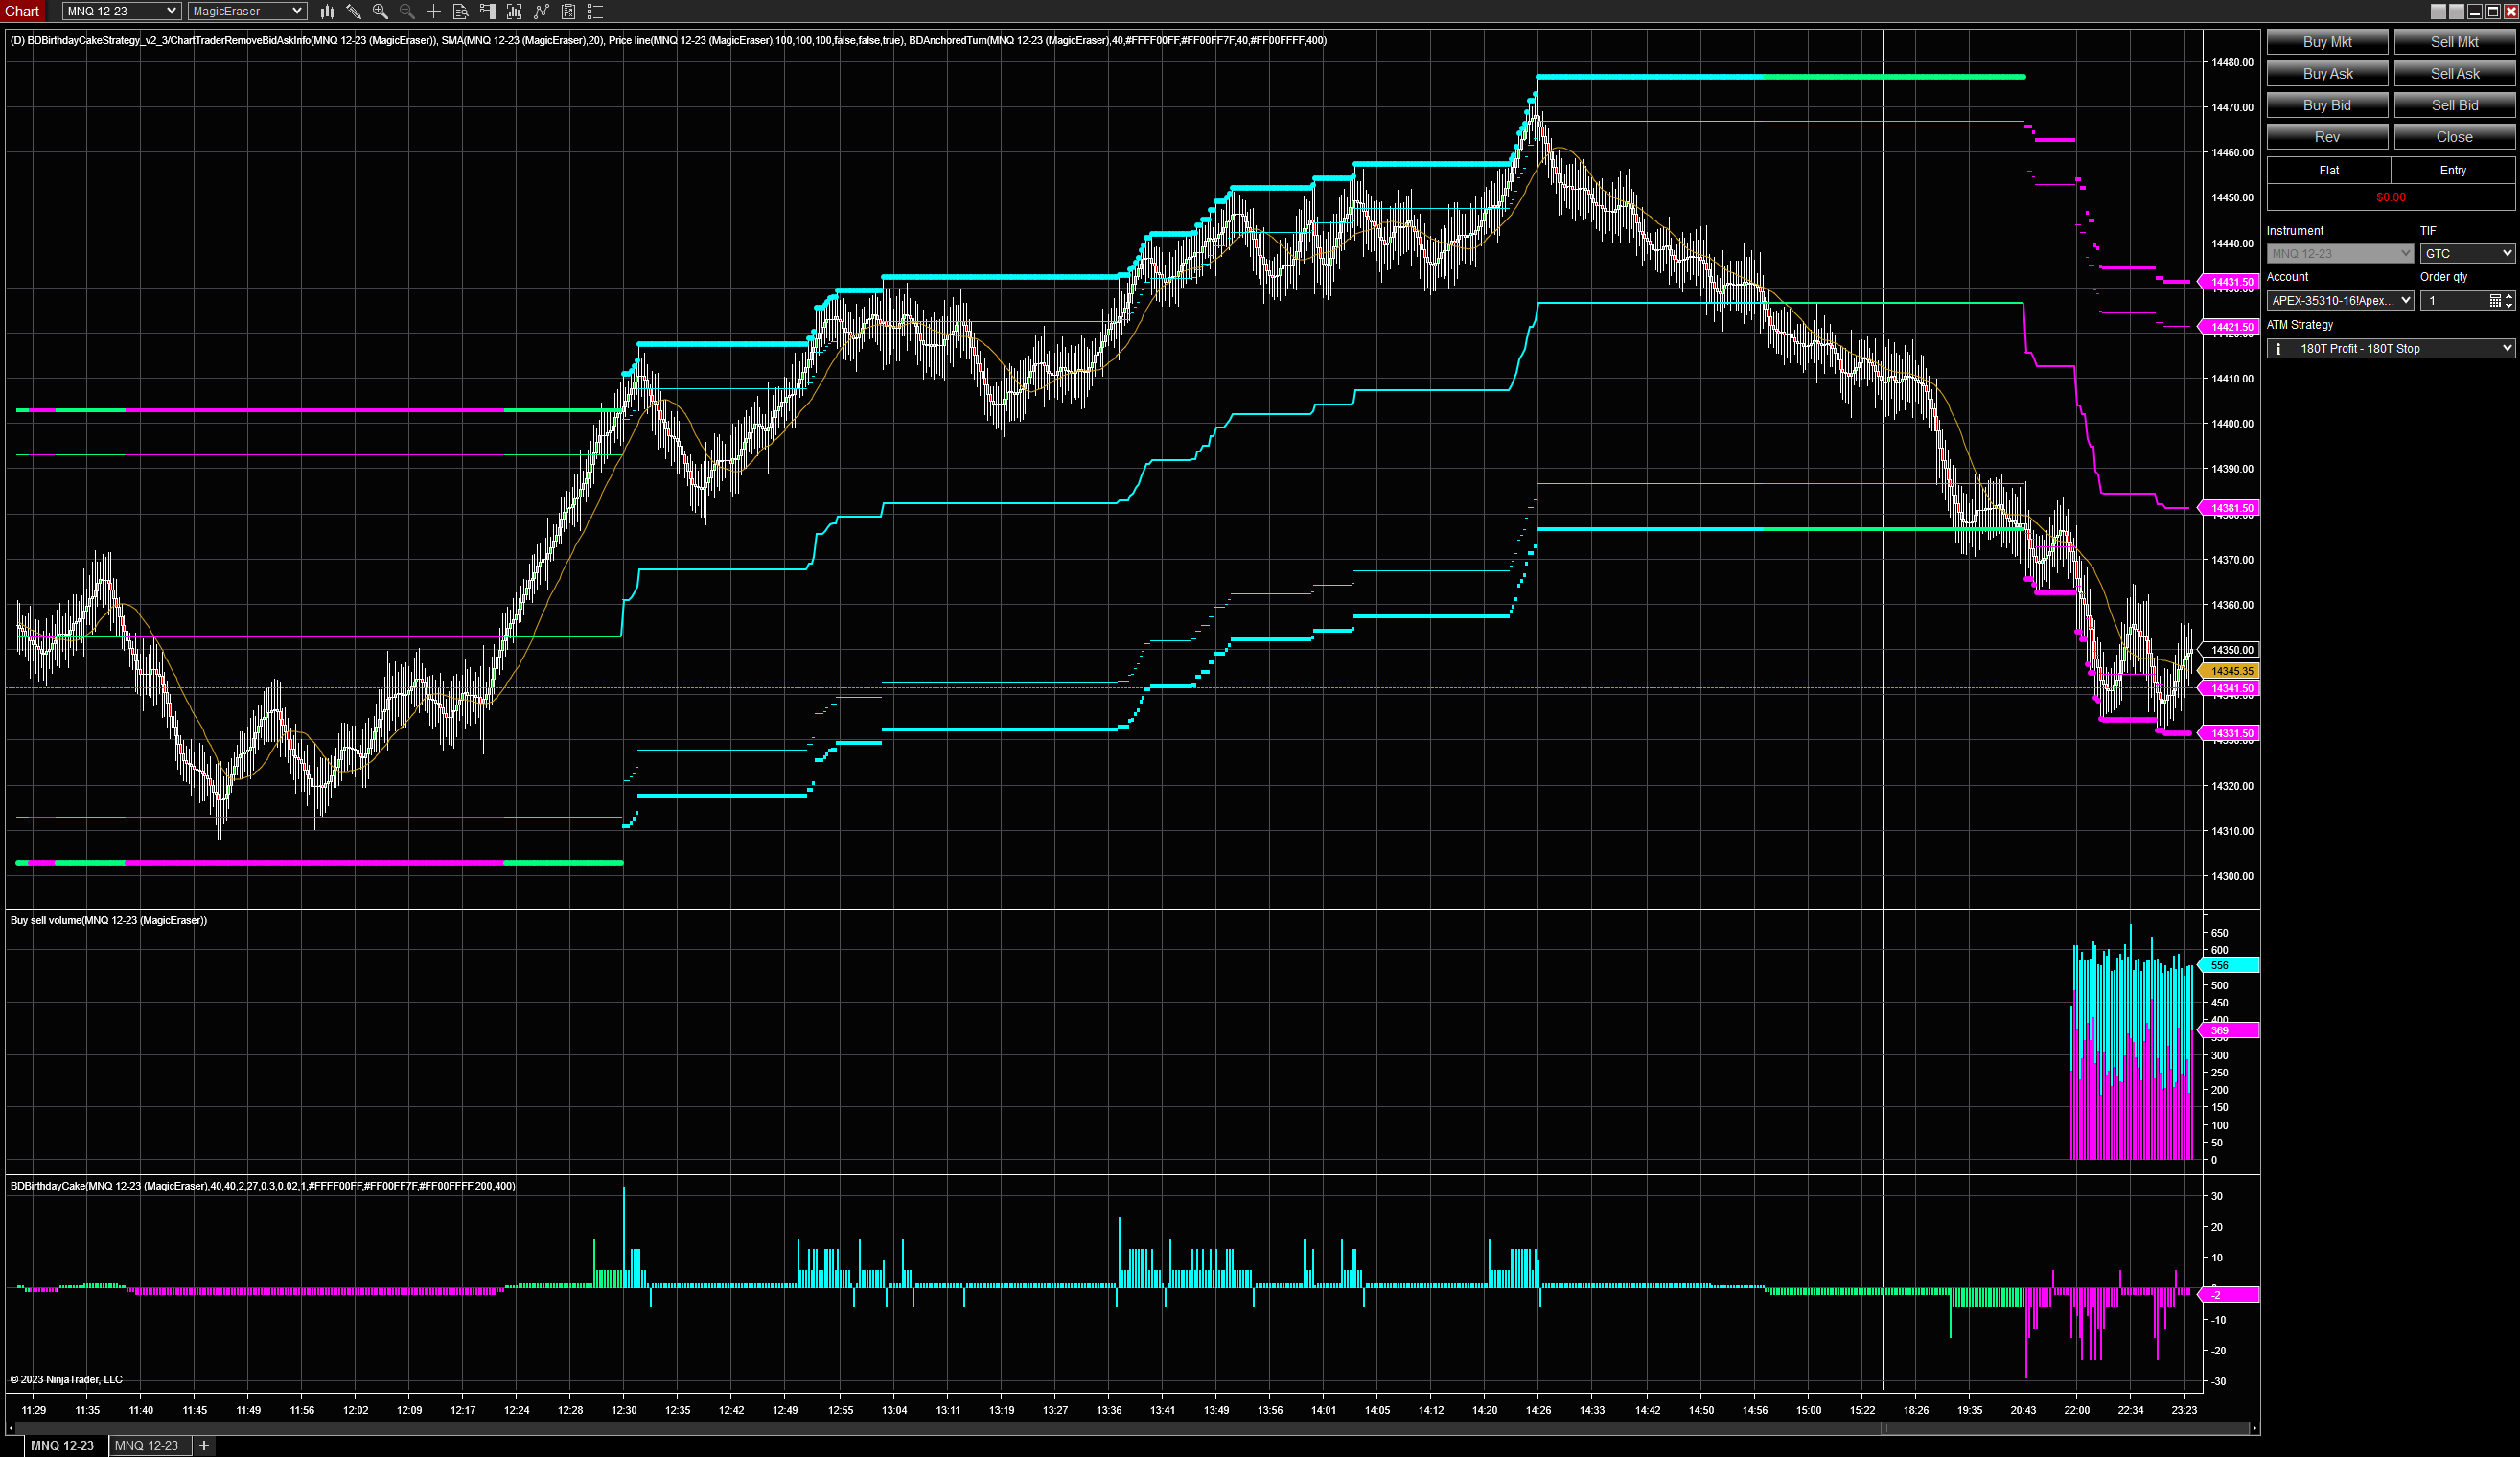
These bars reduce the number of reported crosses at a specific price due to wide spreads and fast DOM action. If your strategies require entries at a specific price you will find that these bars reduce the whipsaws in tick based bars.
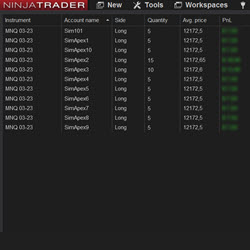
With this tool you can copy your own trades to multiple accounts from the same broker. If you use Propfirms with multiple accounts this is a must have for you. You can trade up to 20 accounts, open orders between different instruments, and have the possibility for an order multiplier.
December 2, 2024
Mastering Sideways Markets With Auction Bars and Range Projections
November 19, 2024
Enhancing Your Automated Trading System: Key Insights from Best Pro Trade
November 14, 2024
NinjaTrader New Ecosystem Tools: October 2024 Edition
Enter Email for Updates