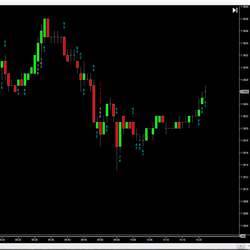
This is the ultimate mean Renko version (with wicks) for NinjaTrader 8. It removes noise and helps visualize trends. ninZaRenko can be used for charting, trading, backtesting, and programming. It is trusted and loved by thousands of traders worldwide. Download free now!
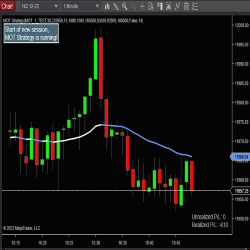
MightyOxTrading Strategy is an automated trading strategy for NinjaTrader 8. It has the option to use higher-timeframe bars as a filter for potential trades. It uses an ATM strategy for order management, so you can configure it for a single contract or for multiple contracts using a "runner".
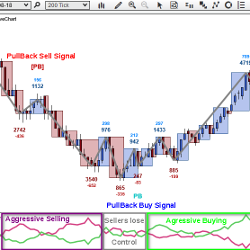
The MBidAskOscillator separates volume into trades executed at the best bid price, and trades executed at the best ask price. This indicator gives traders insight into market action, because evidence of aggressive selling or buying is clearly represented.
The ORB Trading System includes fully automated trading strategies and discretionary trading indicators. A quantitative analytic approach to trading stocks, ETFs and futures, the ORB uses a unique system for identifying swing trading opportunities. Use in both NinjaTrader 7 and 8!
Precision Divergence Finder is designed to find bullish divergences in Demand Index readings in real time with no delay or re-painting. It can often pinpoint precise market bottoms and using this product can give you the insight needed to increase the chances of finding the exact market low point.
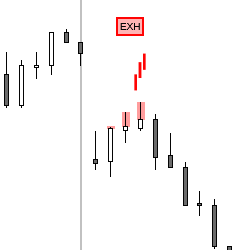
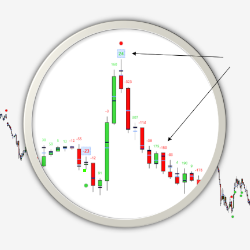
This indicator is a new approach to Price Action trading. It identifies momentum and exhaustion by examining bar features and relation to prior bars in great detail. It can be used as a discretionary indicator or for automated (e.g. BloodHound) trading. Get started with a free 20-day trial today!
This NinjaTrader indicator is programmed to highlight the big money trades. The numbers are placed under each bar which makes it easy to see where the action/noise is taking place.
Identify the important buyer and seller zones in each candle by combining the processing of footprint information and a candle chart. Focus on your entries and exits. Get started today with a free 2-week trial!
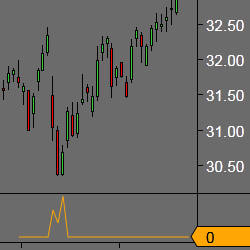
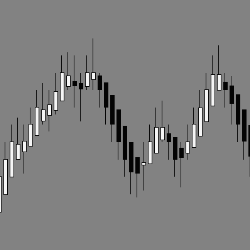
EPyFBarsType is a tick-based bar, unlike time-based bars such as regular Japanese candles. These bars are one of the main components of our system, due to the objectivity they provide for technical analysis. This bar type helps in identifying market moves and avoiding choppy areas.
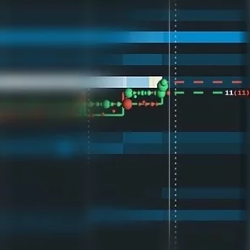
A fantastic way of using the Quotes Delta setting on Bookmap.com to identify whether important support and liquidity levels will hold or break, the Sweep Show setup has helped Nic understand when it was time to fade a move or go with it in E-mini S&P 500 futures.
December 2, 2024
Mastering Sideways Markets With Auction Bars and Range Projections
November 19, 2024
Enhancing Your Automated Trading System: Key Insights from Best Pro Trade
November 14, 2024
NinjaTrader New Ecosystem Tools: October 2024 Edition
Enter Email for Updates