Recently updated, the Conway Market DNA Day Trading System now includes Auto Strategy Trade Entry and Exit and a simplified Order Flow which projects 1 bar into the future. Also included is our Chop Filter Indicator, which will not take trades in a choppy market, and a 236-page product manual.
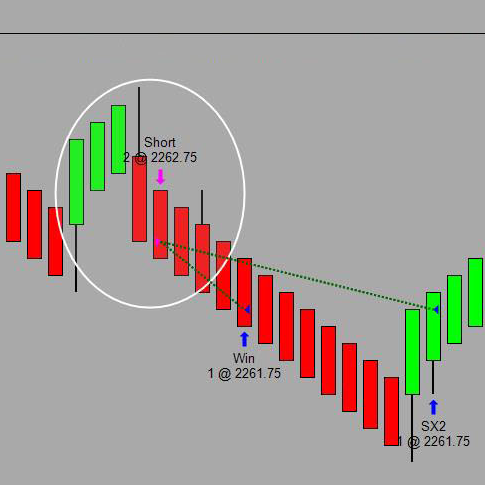
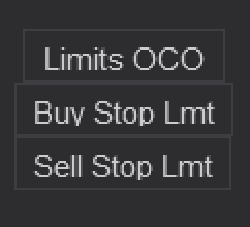
Bars Edge Trader Button and OCO Timer pack for NinjaTrader 8. An easy fast solution to apply Limit Orders to your Chart Trader. Included are three timers for adding OCO Limits entries throughout the day to catch a news cycles semi-automatically.
Hey Overachiever, I see you! Don’t worry—you’re in the right place. You’ve made a habit of outperforming, so why not arm yourself with the best team to help continue your winning streak? We code (like hackers) and launch (like marketers) your products. Click and schedule a free consultancy call.
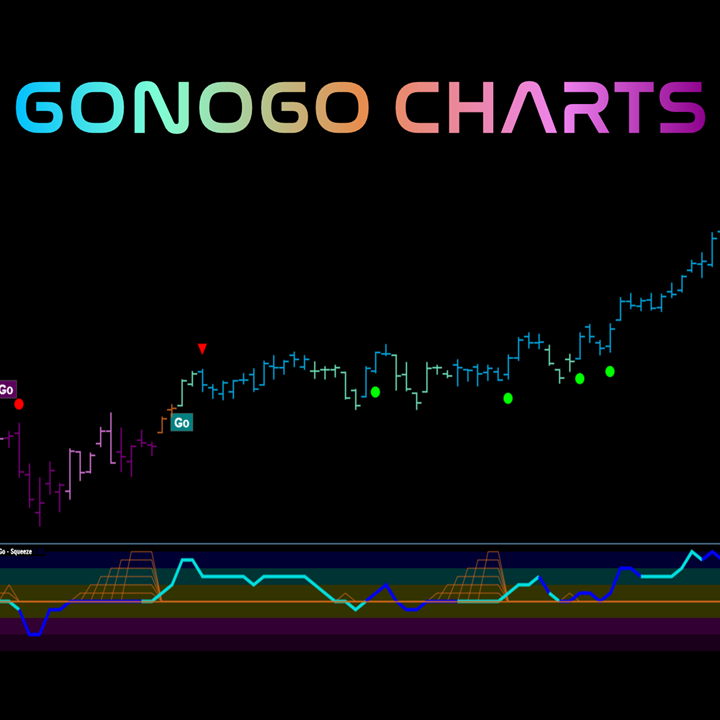
GoNoGo Charts® incorporates multiple widely tested and commonly used technical indicators into proprietary trend and momentum models for a complete technical perspective without cluttering your charts. GoNoGo Trend® is a model that includes tools like multiple period moving averages and more.
Expert Trading Programmers specializes in NinjaTrader indicators, strategies, add-ons, bar types, chart styles, drawing tools, performance metrics, and much more! Their products work on Futures, Forex and/or Stock markets. Get a free quote on your programming project now!
We have added two new products for market analyzer. One works in conjunction with DualTrend 2.0 to keep you aware what market is trending so you can trade with the trend. The other works with CB ZoneChart V5. It will let you know if your market is in the lower zone or Upper Zone.
A powerful self-study program that will help you learn the core principles and implementation of the Hunt Volatility Funnel Method with a total of 18 hours of material, topic by topic, alongside case studies and live trading webinars.
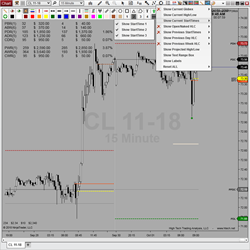
Price Times Plus plots 24 current, previous & projected OHLCR levels of significance! It features both daily & weekly levels, projected ranges, 3 user defined start times, unique summary information, a toolbar icon for easy configuration, and is Market Analyzer, Strategy Builder & Bloodhound ready!
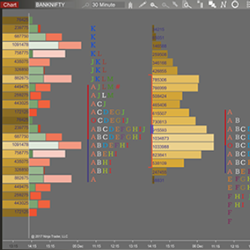
Bell Market Profile aims to help traders visualize what is actually happening in the market by displaying where trades are occurring. It features split vs composite profile, high volume alerts, absolute volume profile all with customizable colors.
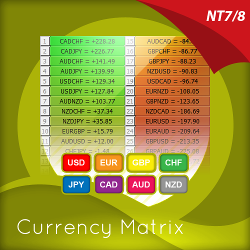
The currency matrix indicator is a simple solution to a complex problem, revealing sentiment for the currency across the currency complex. Now traders can know when they're trading with the universal flow, not against it. Learn more about this unique Forex indicator for NinjaTrader!
December 2, 2024
Mastering Sideways Markets With Auction Bars and Range Projections
November 19, 2024
Enhancing Your Automated Trading System: Key Insights from Best Pro Trade
November 14, 2024
NinjaTrader New Ecosystem Tools: October 2024 Edition
Enter Email for Updates