Delta Volume Supply and Demand Indicator that comes with a Semi Auto Chart Trader. Prop firm compliant for evaluations and live accounts. Reads what is happening right now in the market with no lag. Templates, workspaces and manual included. Works in all markets. Free 7-day Trial.
According to your technical plan, Advanced Software Features will implement a trading idea or an indicator idea using the C# computer code and the NinjaTrader 8 terminal. With the help of additional mathematical libraries, they will be able to develop complex trading algorithms with you.
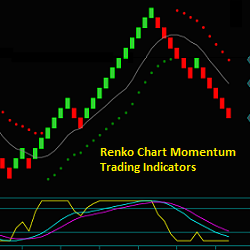
The Renko chart trading method and trading indicator training include Renko chart momentum reverse trades that begin a new swing, trading pullbacks with momentum resumption and flow for price continuation, and trading swing reverses with price and momentum extremes or divergences.
Gain a competitive edge via the proven performance of Wyckoff VSA and its fully customizable SMART package, which is configurable to your individual trading plan, style and strategy. Fully configurable SMART Technology. Advanced configurable trading filters. Advanced management tools.
Copy your trading from full futures (e.g., ES, FDAX to Mini or Micro Future [MES, FDXS/M]) to live accounts. Smart and easy-to-use. Combine the analysis from full futures with the risk management possible with mini or micro futures. Get started today with a two-week free trial!
Automatically snap trade execution screenshots or take a snap at a set bar interval. SnapMyTrade assists traders with journaling and post trade analysis.
BookMap helps traders detect better support and resistance levels by plotting order book data directly on the chart. Through market depth behind price bars, order flow traders can watch the limit order book unfold in real time, highlighting significant price levels such as support and resistance.
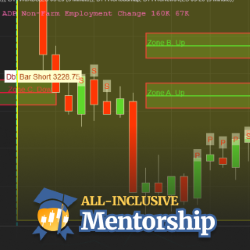
Become a pro trader via an eight-week trading school. All courses & software are included. Receive live training from a coach who teaches you over 10 price action methods & how they work together to form a complete plan for daily trading. Learn the exclusive Roadmap & Blueprint techniques.
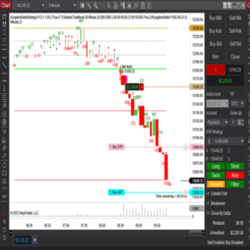
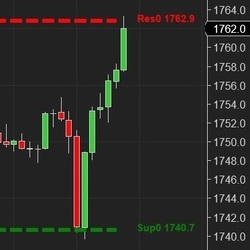
The Buy/Sell Zones are an adaptive approach to expansion and contraction within market rotations. Each rotation provides an area of interest for either the bid or offer, where they need to engage in order to protect the possibility of further extension. This approach allows you to trade with trend.
Based on an Artificial Intelligence (AI) engine, the E.G. Trigger Point calculates support and resistance (S&R) lines. The S&R are specific price points on a chart expected to attract the maximum amount of either buying or selling.
March 25, 2024
Trading Pullbacks and Reversals: Simplifying a Once Complex Retail Trading Strategy
March 21, 2024
VWAP Indicator: Average Price Shown Based on Price, Volume
March 18, 2024
Trade Copier Strategies: Make Efficiency Work for You When Futures Trading
Enter Email for Updates