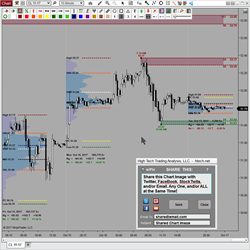
Chart Capture and Sharing provides a simple, easy, and convenient all-in-one solution for chart image capture and sharing! It is a one-click solution to automatically capture and save an image of your chart, and optionally share that image to email, Twitter, StockTwits, and/or Facebook.
Innovative Trading Solutions has been building indicators, fully-automated or ATM Strategies, chart types, and chart styles to client specifications for over 8 years. They also offer NinjaTrader 7 to NinjaTrader 8 conversion services. Get a free quote for your project today!
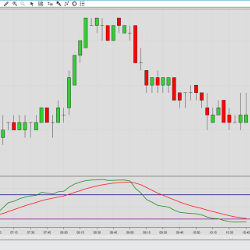
The Slow Relative Strength Index is an adaptation of the classic RSI calculation, customized for use in higher timeframes. The slow RSI calculation compares the close price with an exponential moving average instead of the previous value.
Download a 14-day test period of this trading indicator that identifies points to enter the market for price pullbacks and reversals. The indicator uses pure price action, which makes it possible to get rid of lagging indicators. Be independent of the values and stage of the market.
These are some free indicators that can help you gain an easier and more informed understanding of your trades. Risk calculator, easy entry, volume bar and trend indicators all may help you to avoid mistakes.
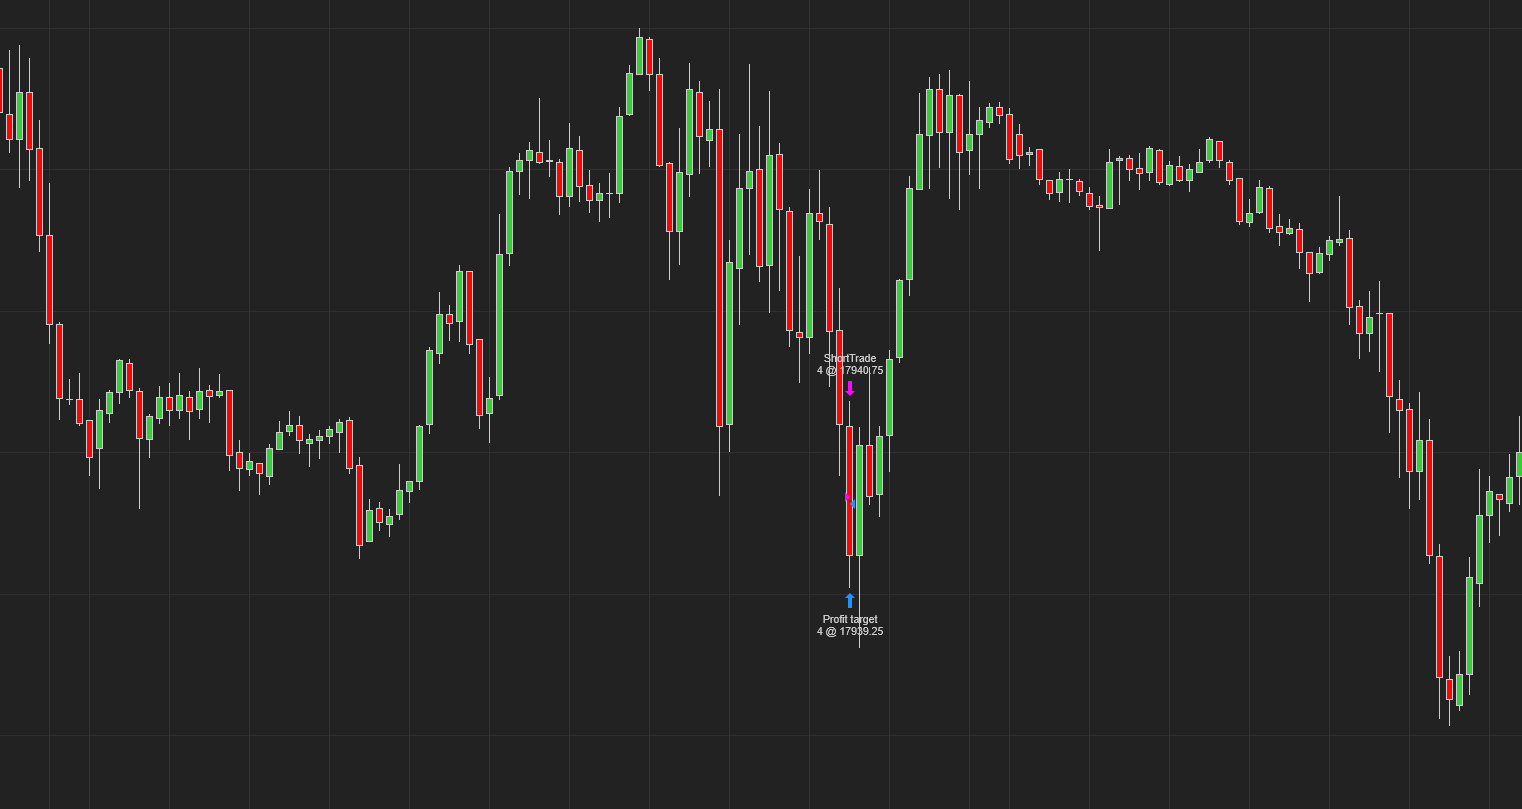
This algo-based buy sell NQ strategy customized number of traders per day.
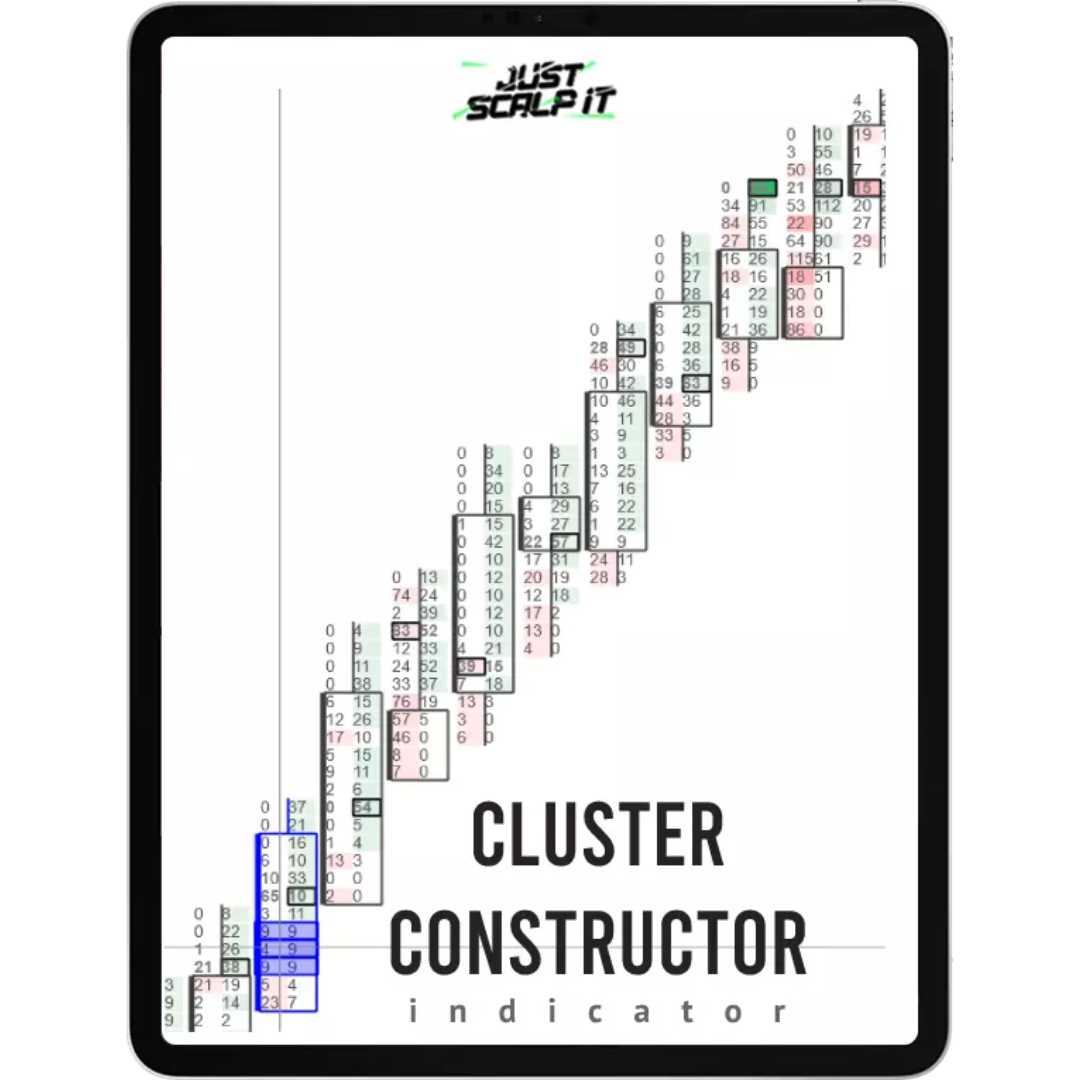
Explore the advanced order flow indicator, Cluster Constructor, featuring 16+ filters for deep market analysis (footprint charts). Ideal for unveiling smart money and institutional trends, enhancing order flow trading strategies. Delve into sophisticated insights – start now!
The Helix strategy is the combination of our Entry Zone indicator and the Trade Management strategy, hence the name Helix (or double Helix). Helix allows you to create your Entry Zones based on your setup rules. Then, after trade execution, Helix will manage the trade based on your rules.
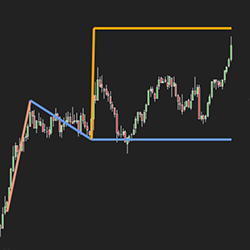
Measured moves are one of the most common trading strategies. However, they can be easy to miss. The Automated Measured Move Indicator from Tyche Trading takes away that difficulty, allowing you to focus on your trading. Never miss a measured move again. Get your seven-day free trial today!
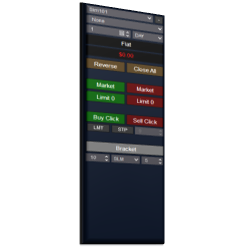
The Bracket Entry Orders module is great for capturing momentum in fast moving market during periods of high activity or following a news event. The “Bracket” button gets the last traded price and initiates a buy order above the market and a sell order below the market simultaneously.
December 2, 2024
Mastering Sideways Markets With Auction Bars and Range Projections
November 19, 2024
Enhancing Your Automated Trading System: Key Insights from Best Pro Trade
November 14, 2024
NinjaTrader New Ecosystem Tools: October 2024 Edition
Enter Email for Updates