The platform is responsible for finding multiple patterns in operations and provides statistics which help traders in the decision-making process. Try it now free!
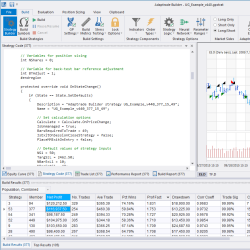
Developing automated trading strategies can be time consuming and difficult. Adaptrade Builder is an advanced trading strategy generator that will quickly find, code and test unique and complete trading strategies based on your requirements. Start building strategies today with a free 30-day trial!
DataGrabber™ grabs price and volume data for any futures instrument. It is designed to work with the AI prediction software, AITrendPredictor™. DataGrabber™ data files get fed into AITrendPredictor™ to train the AI model to find patterns on price, volume, day and time to make a price prediction.
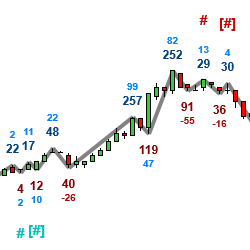
MBoxWave Algorithmic Buy / Sell Signals use Wyckoff concepts in analyzing waves, volume, delta volume, effort / result, etc... It allows you to easily scan charts for certain conditions to meet a criteria and then showing a signal that a potential trade setup has occurred.
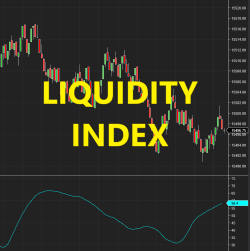
Liquidity is one of the most important signals that traders can pay attention to in the market. It shows how market participants are feeding the price levels. It is not only for limit orders but also related to the speed that traders and institutions can respond to new price actions.
RTMC MNTrader is a fully automated trading system. Trading is based on Renko strategy using an exponential moving average. Filtering system based on the MACD and TMA Slope indicators. It has an improved position support system with flexible settings that will improve trading consistency.
Douro Day Trading indicators are specifically designed for five minute chart trading targeting the European open, US premarket, US open and US. They are also designed for 5 minute, 15 minute and 60 minute combination trading, and produce up to 60 valid trades in a 24 hour period.
Would you like to improve your trading? Learn how to analyze the live market & the key factors that are critical for success! Open M-F, 9 – 11 AM ET, the Member Room provides the knowledge & demonstrates the tools needed to trade the ES, NQ, CL & more. Get started NOW with FREE live market training!
The EminiScalp Stalker is an automated strategy that is designed to assist traders with the ever-difficult emotion of entering and staying with a trade. The Stalker searches for potential scalping and trend entries throughout the trading session.
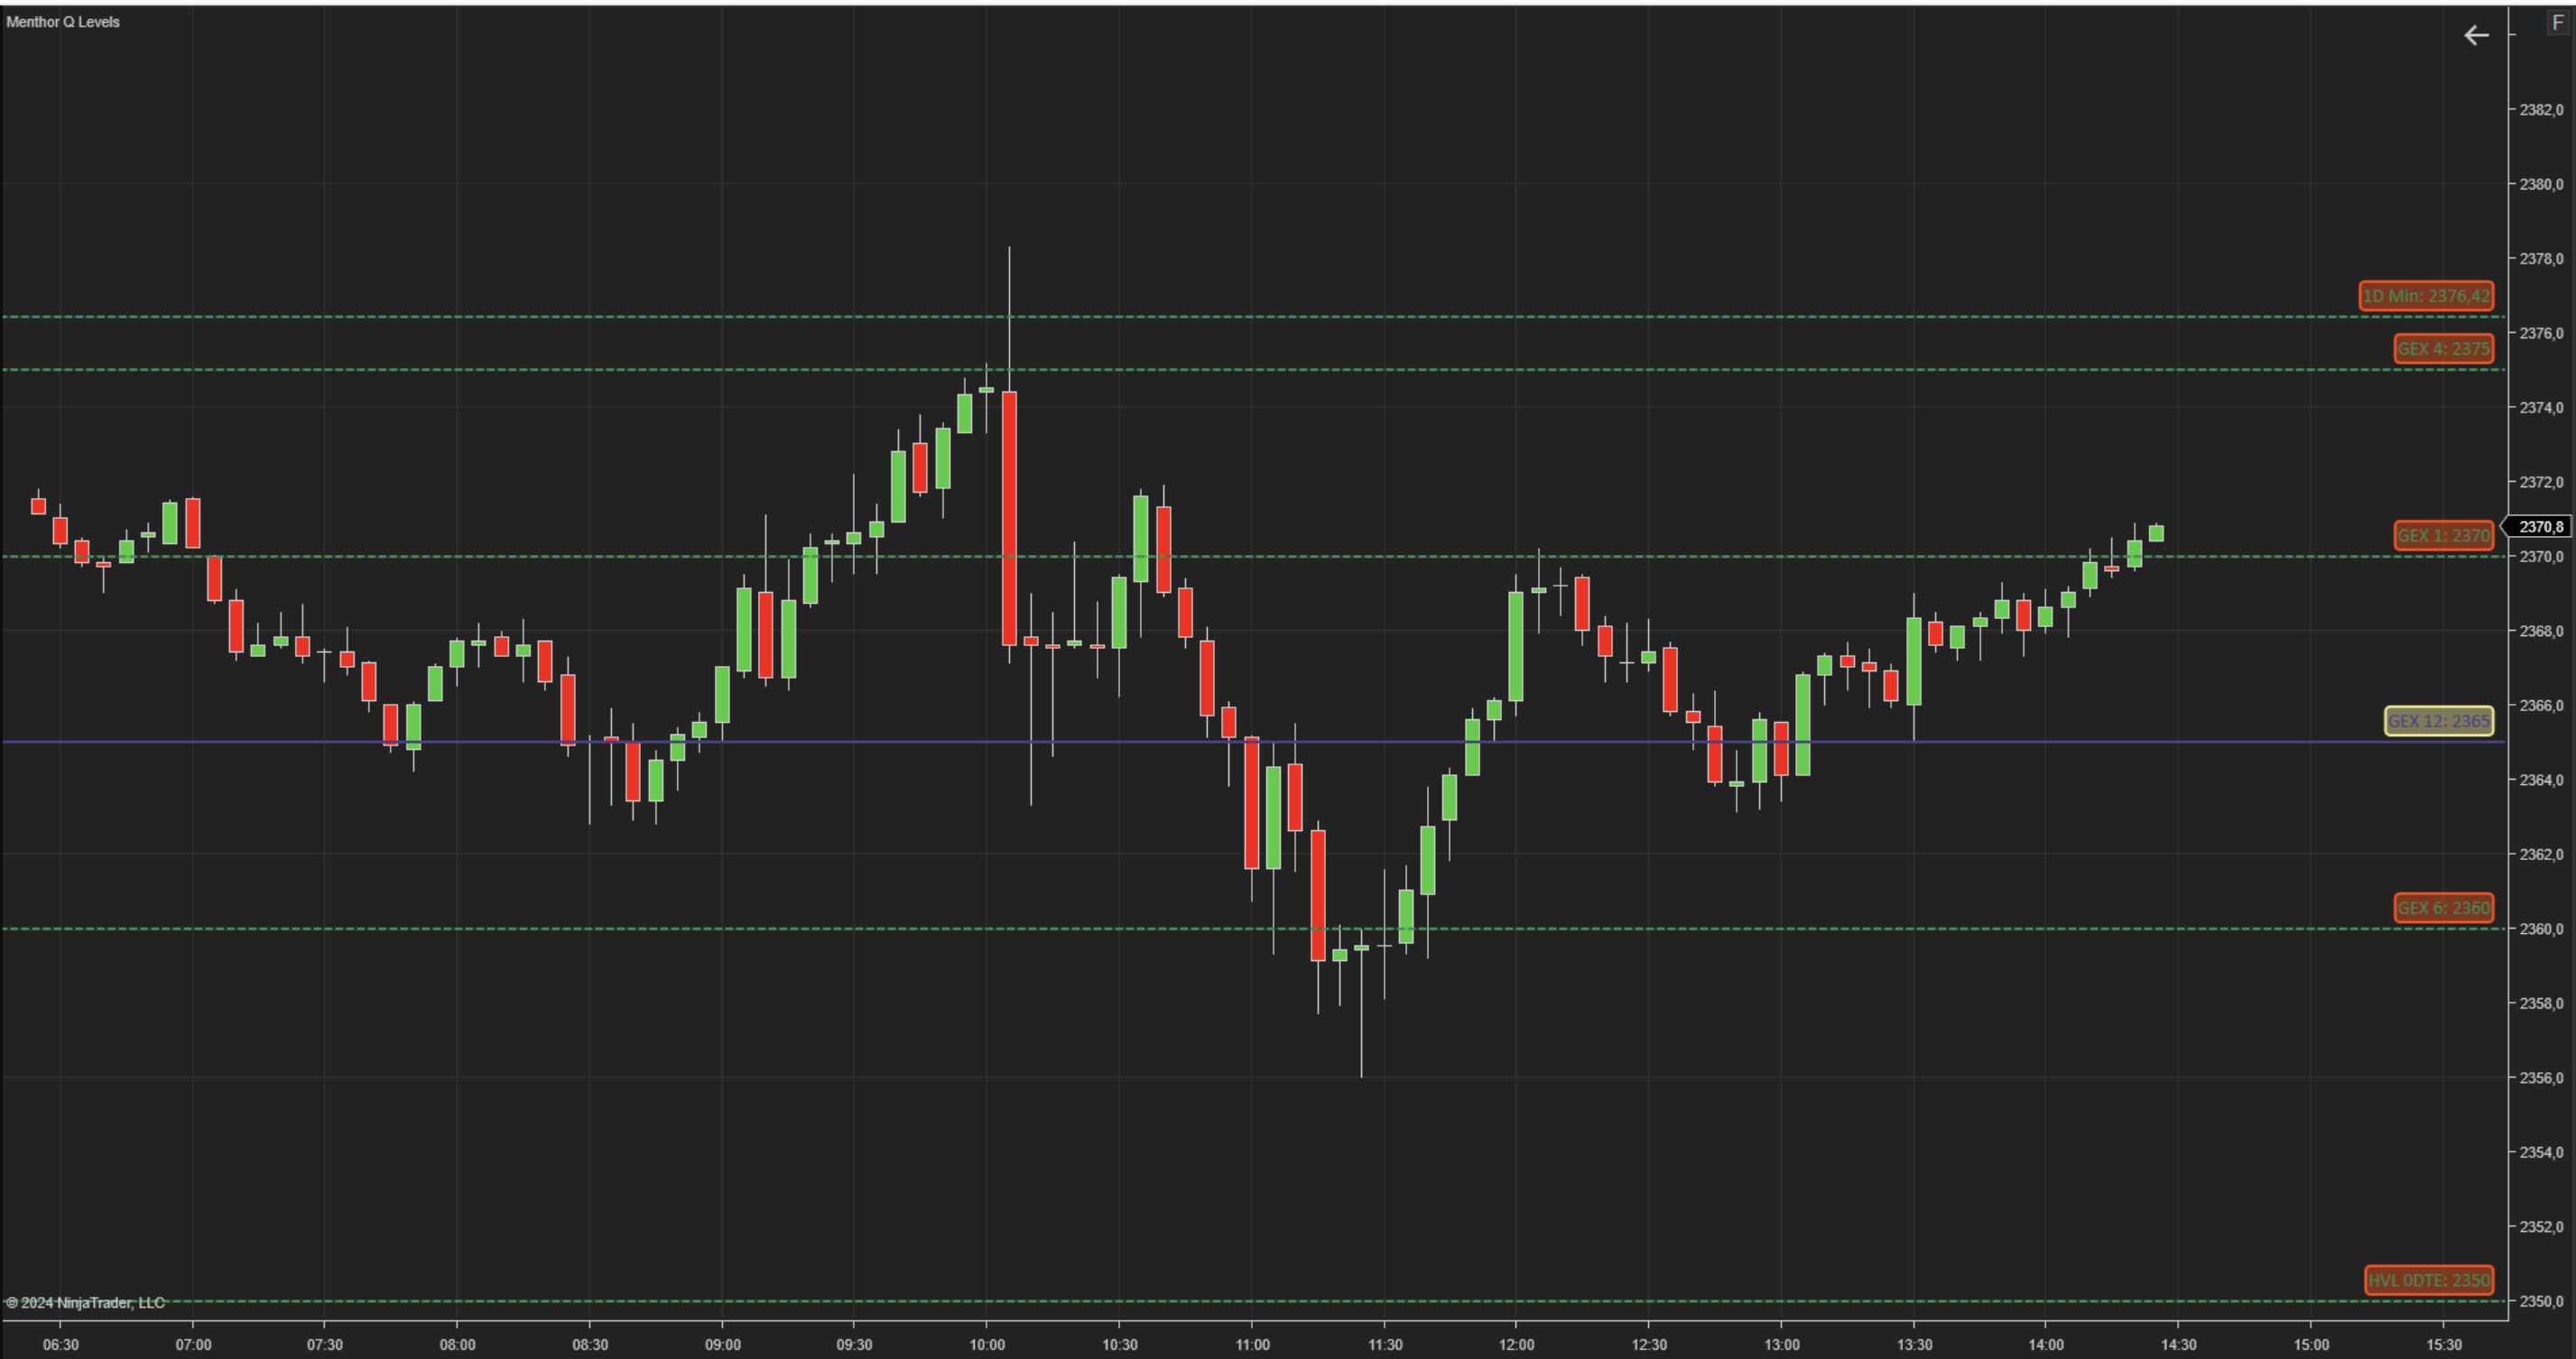
The Menthor Q-Levels indicator for NinjaTrader revolutionizes trading by deriving key levels and market reaction zones directly from options data. Seamlessly integrated into your chart, this innovative tool provides traders with precise and actionable levels that enhance decision-making.
December 2, 2024
Mastering Sideways Markets With Auction Bars and Range Projections
November 19, 2024
Enhancing Your Automated Trading System: Key Insights from Best Pro Trade
November 14, 2024
NinjaTrader New Ecosystem Tools: October 2024 Edition
Enter Email for Updates