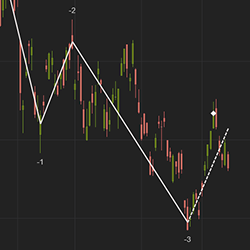
The Wave indicator is similar to an Elliot Wave with an added capability to forecast a possible market reversal. It has convenient features including the ability to number waves to help identify trend direction.
This is an introductory class that is perfect for beginners. It covers a multitude of topics including Technical Analysis and trading with custom indicators. Learn through one-on-one and group live zoom classes daily.
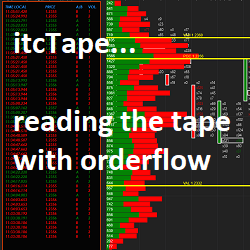
itcTape is a powerful indicator to read the tape & find precise entries in the market. Tape reading is used to follow institutional moves & go along with them. It is used by scalpers as well as by swing traders. The itcTape indicator is highly customizable by size, colors, filter & more.
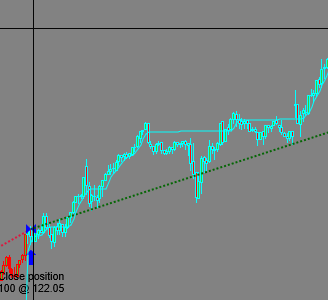
A trend following tool that can achieve exceptionally high risk/reward ratios when applied to suitable markets that trend well. Locks onto trends and does not let go until the trend ends. Not entirely suitable for novices. Strategy, paint bar and indicator included. Automated or manual operation.
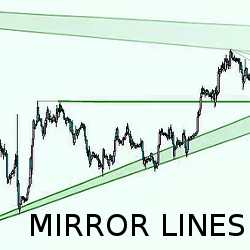
Receive trend forecasts in NinjaTrader 7. MirrorLines paints graphics on the chart that spread out like a torch beam, representing forces hidden within the market’s price structure. Traders can use this data to plan trade entries, stop losses, and smart profit targets.
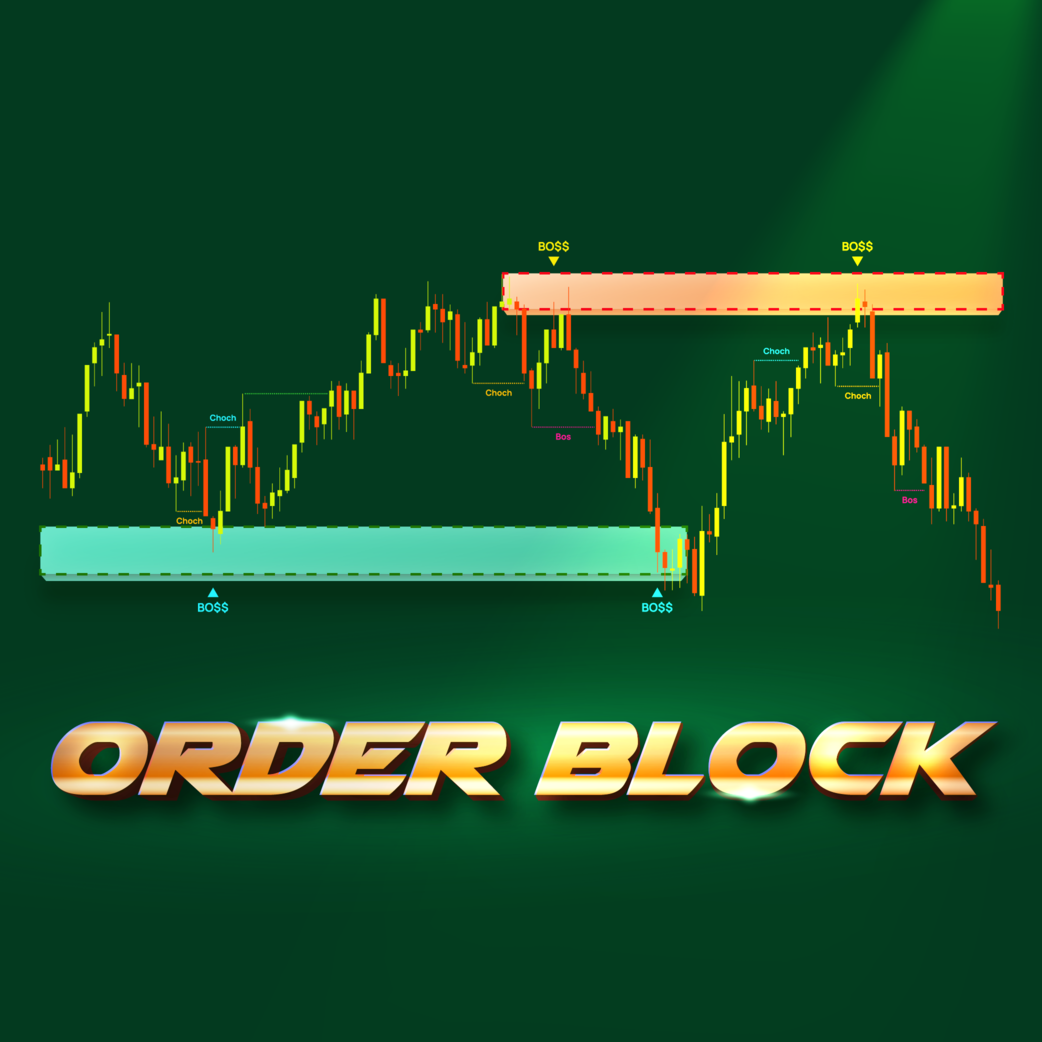
Includes three key factors: Imbalance, BoS (Break of Structure) and CHoCH (Change of Character), and Order Block levels. By integrating these factors, Bo$$ Order Block helps you align your trades with major market shifts, enhancing both your rewards and trading confidence.
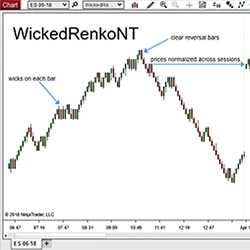
WickedRenkoNT is a custom Renko bar type which is easy to see & logical to interpret. Adding WickedRenkoNT bars to yourchart is extremely helpful in filtering noise on a chart, as well as identifying reversals. Additionally, these bars remove erroneous gaps and align bars across sessions.
BurstAlgo is a straightforward and efficient automated trading tool designed to trade prop-firm accounts. It's built to preform up to three trades daily, focusing on consistent trading. This algorithm is all about keeping things practical.
Q-Scalper indicator identifies the confluence dynamics between Support and Resistance levels with significant Trendlines, providing very significant trade levels. These levels produce very actionable and valuable trade set-ups. Click the link to explore this great indicator.
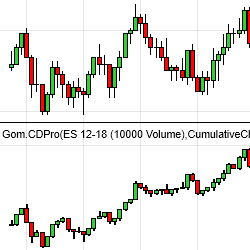
GomCD for NinjaTrader 8 displays the Delta information of the chosen instrument. It shows cumulative or non-cumulative charts, for easy delta analysis and delta divergence identification. It can also be used in custom NinjaTrader strategies and the Market Analyzer.
December 2, 2024
Mastering Sideways Markets With Auction Bars and Range Projections
November 19, 2024
Enhancing Your Automated Trading System: Key Insights from Best Pro Trade
November 14, 2024
NinjaTrader New Ecosystem Tools: October 2024 Edition
Enter Email for Updates