Using Renko/range/tick/volume bars? Optimal Speed analyses the length of time a bar took to form in order to highlight possible congestion areas. Instantly see the slowest bar of the session, slower-than-average bars, crawl bars and the slowest up and down bars of the day. Strategy compatible.
The Emet Trading Solutions team of experienced programmers specialize in converting existing indicators, strategies or code from cAlgo, MetaTrader, TradeStation & MultiCharts to NinjaTrader 7 or NinjaTrader 8. Get a free quote for your project today!
DataGrabber™ grabs price and volume data for any futures instrument. It is designed to work with the AI prediction software, AITrendPredictor™. DataGrabber™ data files get fed into AITrendPredictor™ to train the AI model to find patterns on price, volume, day and time to make a price prediction.
TradeFoxx is an automated trading software designed for the NinjaTrader Desktop platform, version 8. It supports trading in Forex, Futures, and Equities, and offers full automation with time frame control. A free 30-day trial is available, allowing you to test the product before making a purchase.
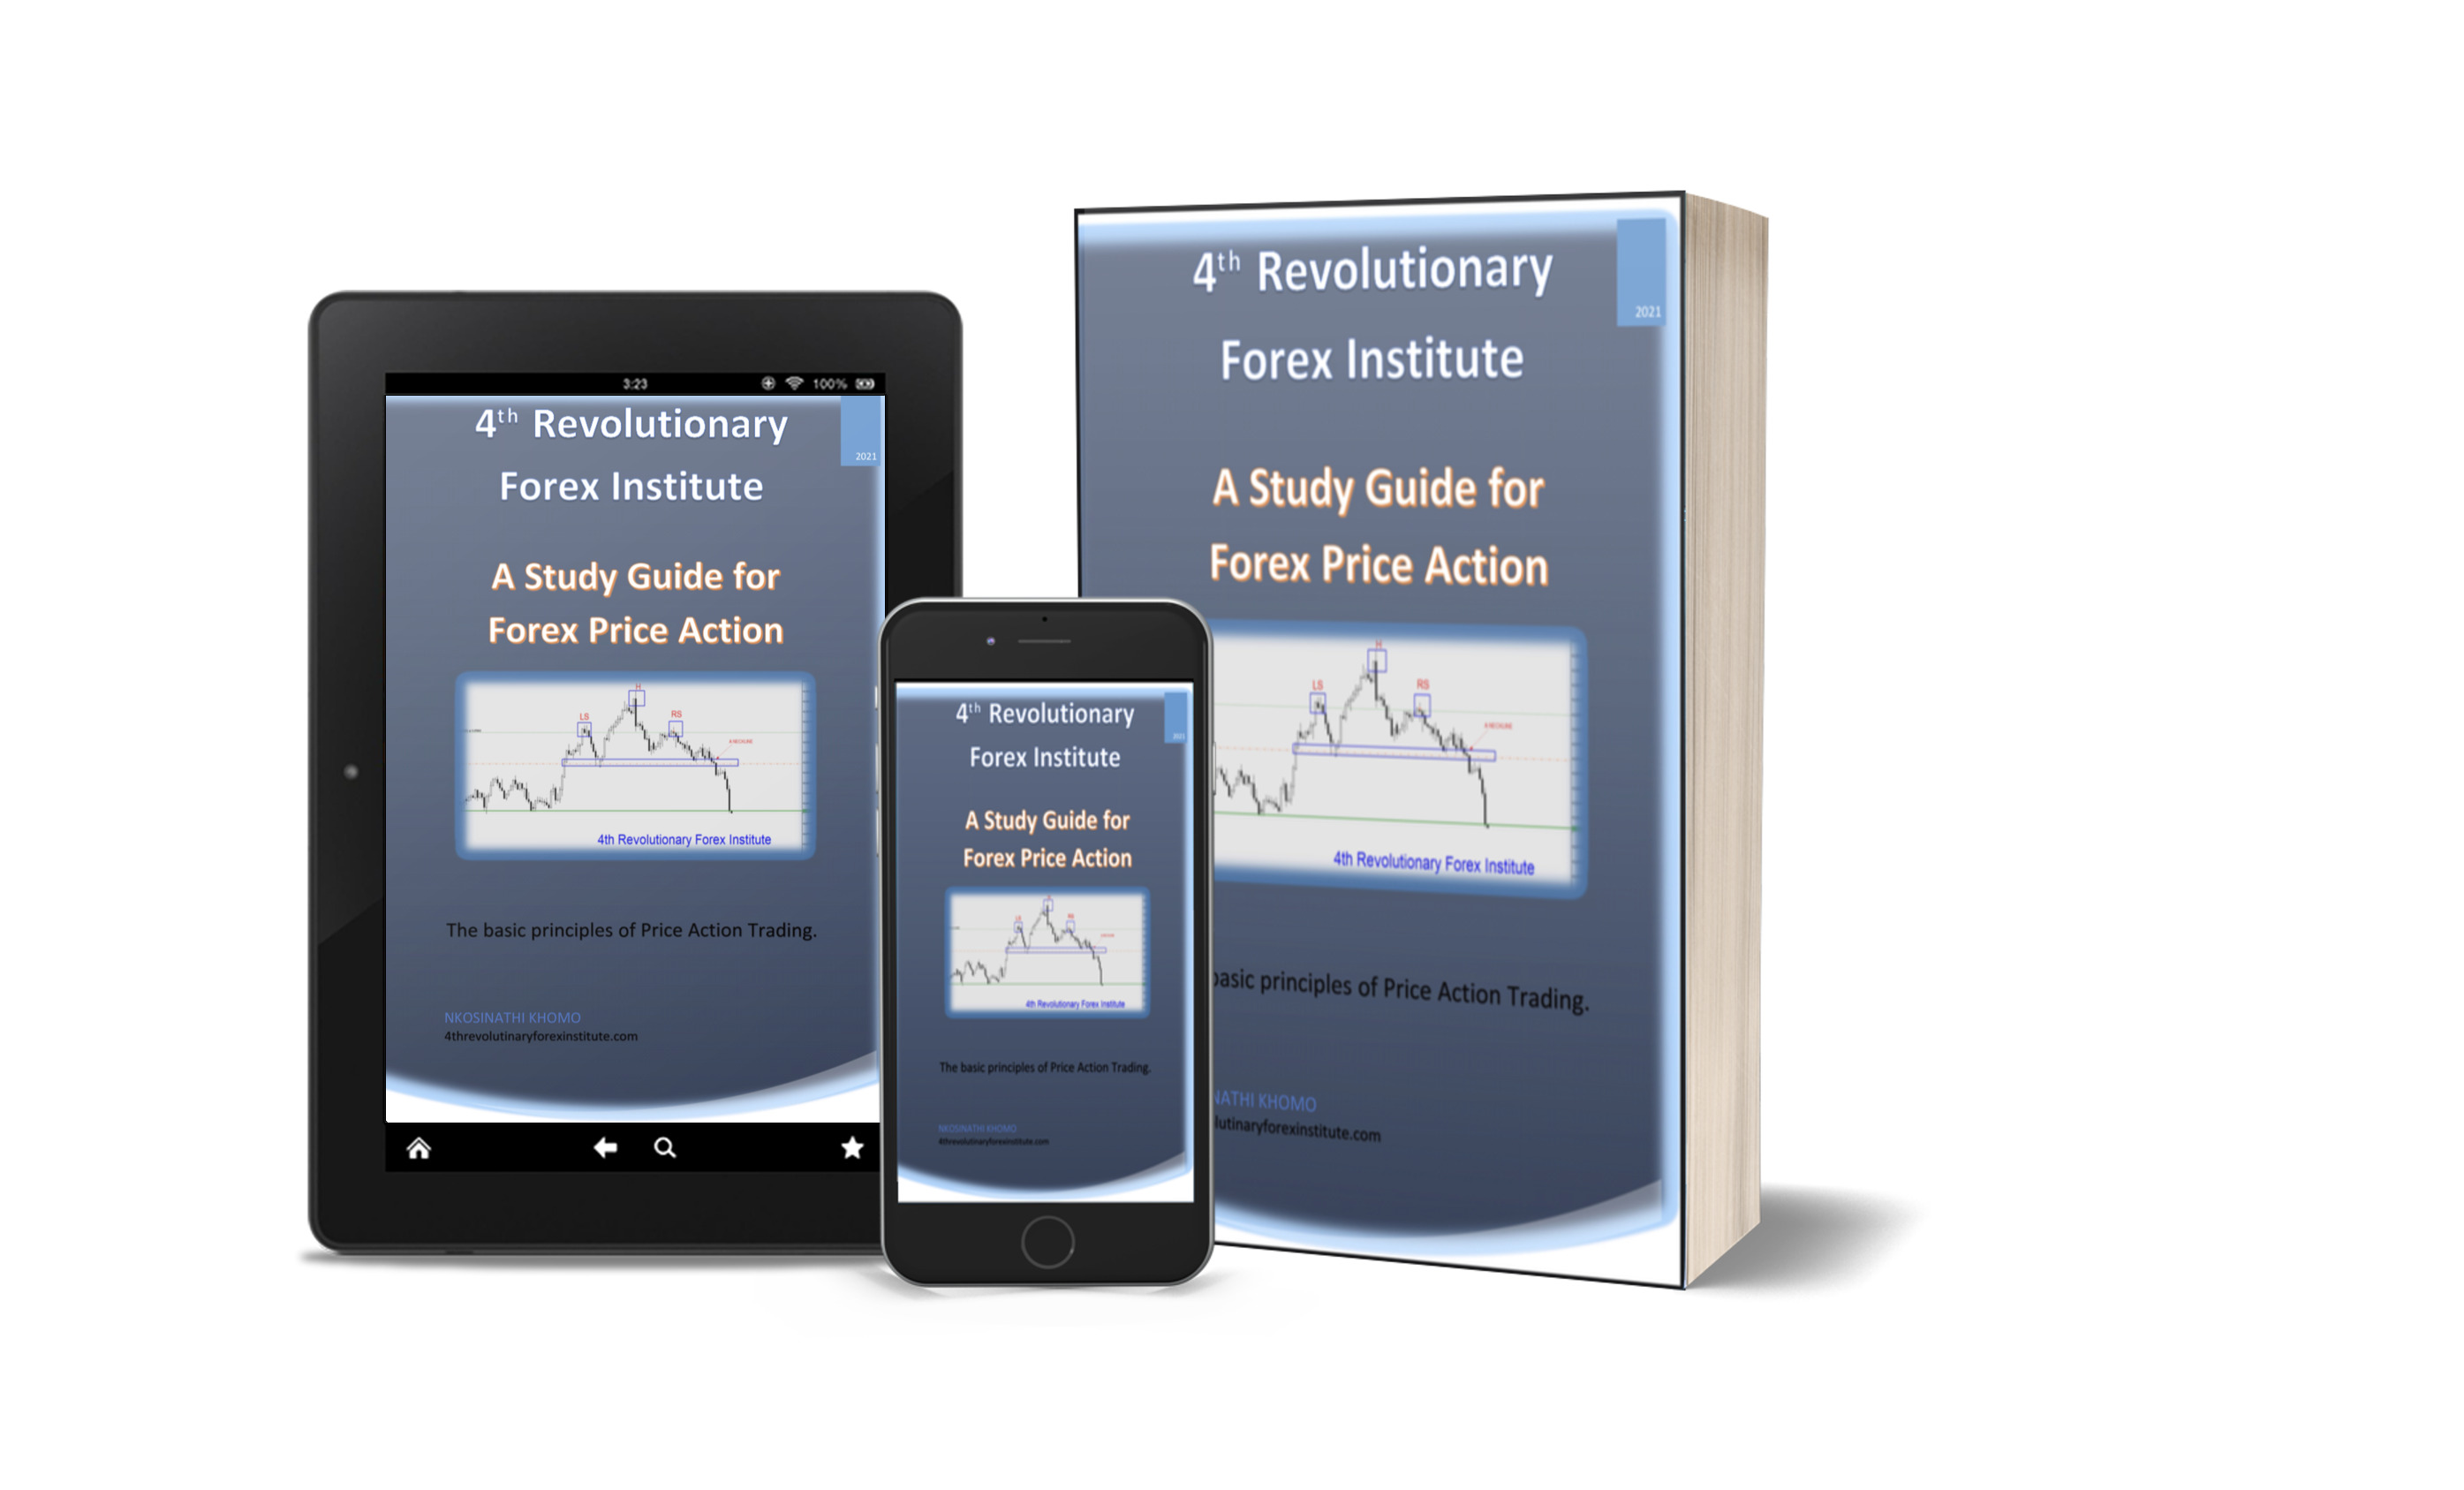
This study guide covers most of chart patterns of the price action. The study will cover trendline strategies, candlesticks patterns, chart patterns, Elliot Wave Theory, harmonic patterns, risk management, trading plan and trading psychology.
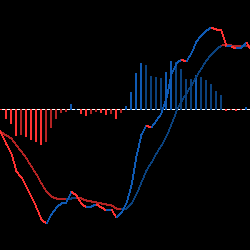
Our MACD Colours is The Prestige Trading Software’s own interpretation of a classic indicator, the MACD. Our version uses a price-reactive color scheme for the elimination of doubt, with everything to the long side turning blue and everything to the short side turning red. Try it for free.
Hey Overachiever, I see you! Don’t worry—you’re in the right place. You’ve made a habit of outperforming, so why not arm yourself with the best team to help continue your winning streak? We code (like hackers) and launch (like marketers) your products. Click and schedule a free consultancy call.
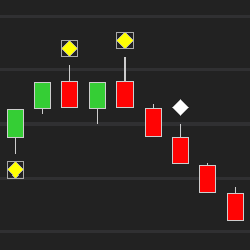
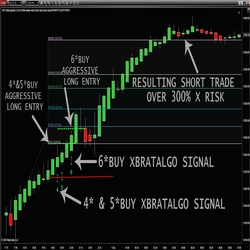
Think of an experienced trader’s brain as a blueprint for a trading algorithm. Then, add the desire to keep charts as clutter-free as possible. Nine decision points defines a 3* trade, 10 decision points makes it a 4* trade, 11 decision points for a 5* trade and 12 decision points for a 6* trade.
Quintalytics develops custom trading software for retail and institutional traders, brokers and other industry professionals for both NinjaTrader 7 and NinjaTrader 8. We have utilized and developed hundreds of custom indicators and trading strategies over 20 years. We can also modify and optimize.
Master price action trading with Al Brooks' extensive video course. Over 100 hours and 52 modules cover E-mini, Forex, commodities, and more. Gain practical strategies and expert insights to enhance your trading skills. Join today and trade with confidence.
December 2, 2024
Mastering Sideways Markets With Auction Bars and Range Projections
November 19, 2024
Enhancing Your Automated Trading System: Key Insights from Best Pro Trade
November 14, 2024
NinjaTrader New Ecosystem Tools: October 2024 Edition
Enter Email for Updates